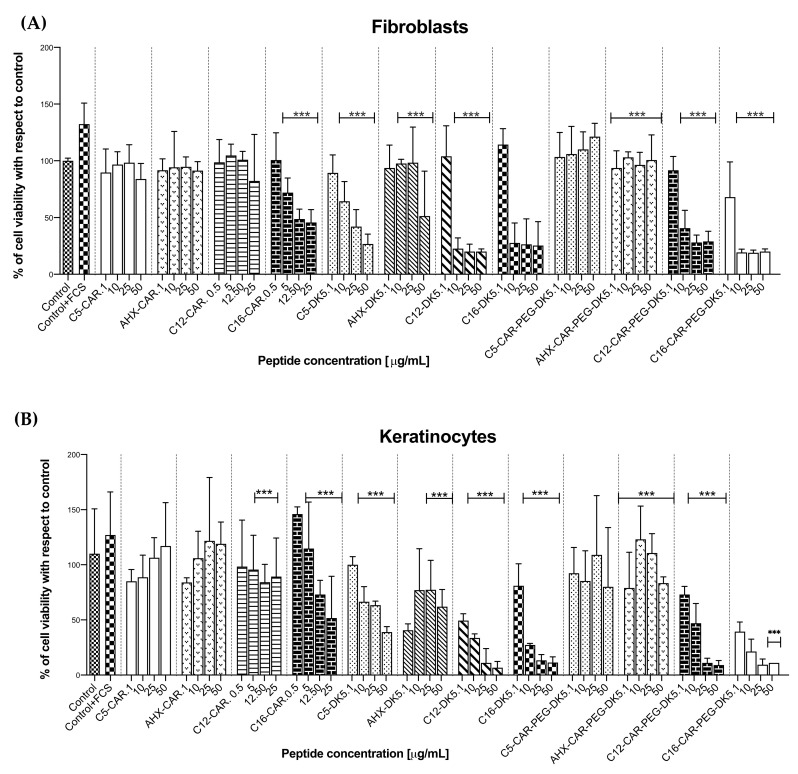
Figure 2.
Evaluation of the cytotoxic effect of the tested compounds on human primary fibroblasts (A) and transformed cell line of human keratinocytes (B).The data cover the results of MTT colorimetric assay and express the percentage of cell viability of the certain probes with respect to control probe (untreated cells, incubated in serum-free DMEM). Additional positive control corresponds to cells incubated in the presence of 10% of FCS in DMEM. All data were obtained from three independent experiments performed in triplicates. Results are expressed with their standard deviation (error bars). *** p < 0.001 vs. control.

