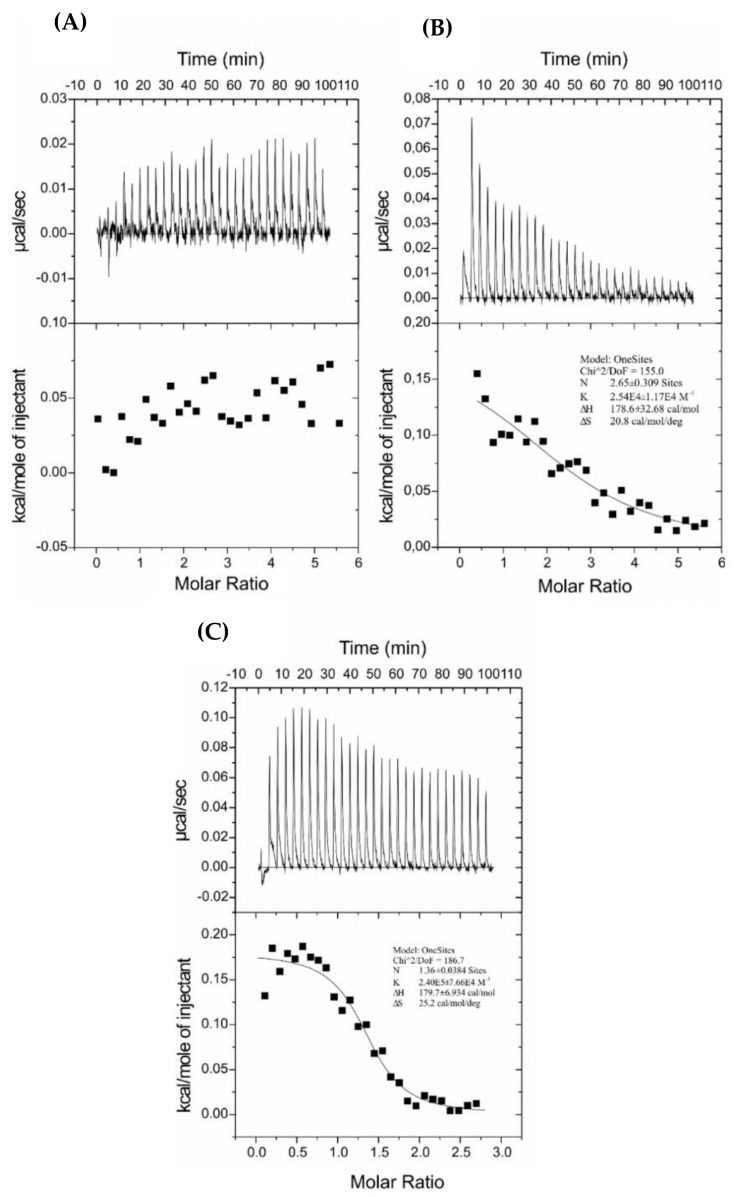
Figure 6.
Isothermal calorimetric titration patterns obtained for titration of (A) 0.05 mM C5-DK5, (B) C12-DK5, (C) 0.1 mM C12-CAR-PEG-DK5 solutions with 1.31 mM POPC LUVs at 25 °C. The lower curves represent the heat of reaction (measured by peak integration) as a function of the lipid/peptide molar ratio.

