
Figure 1. Metabolism of MDMA and corresponding monoamine uptake inhibition curves.
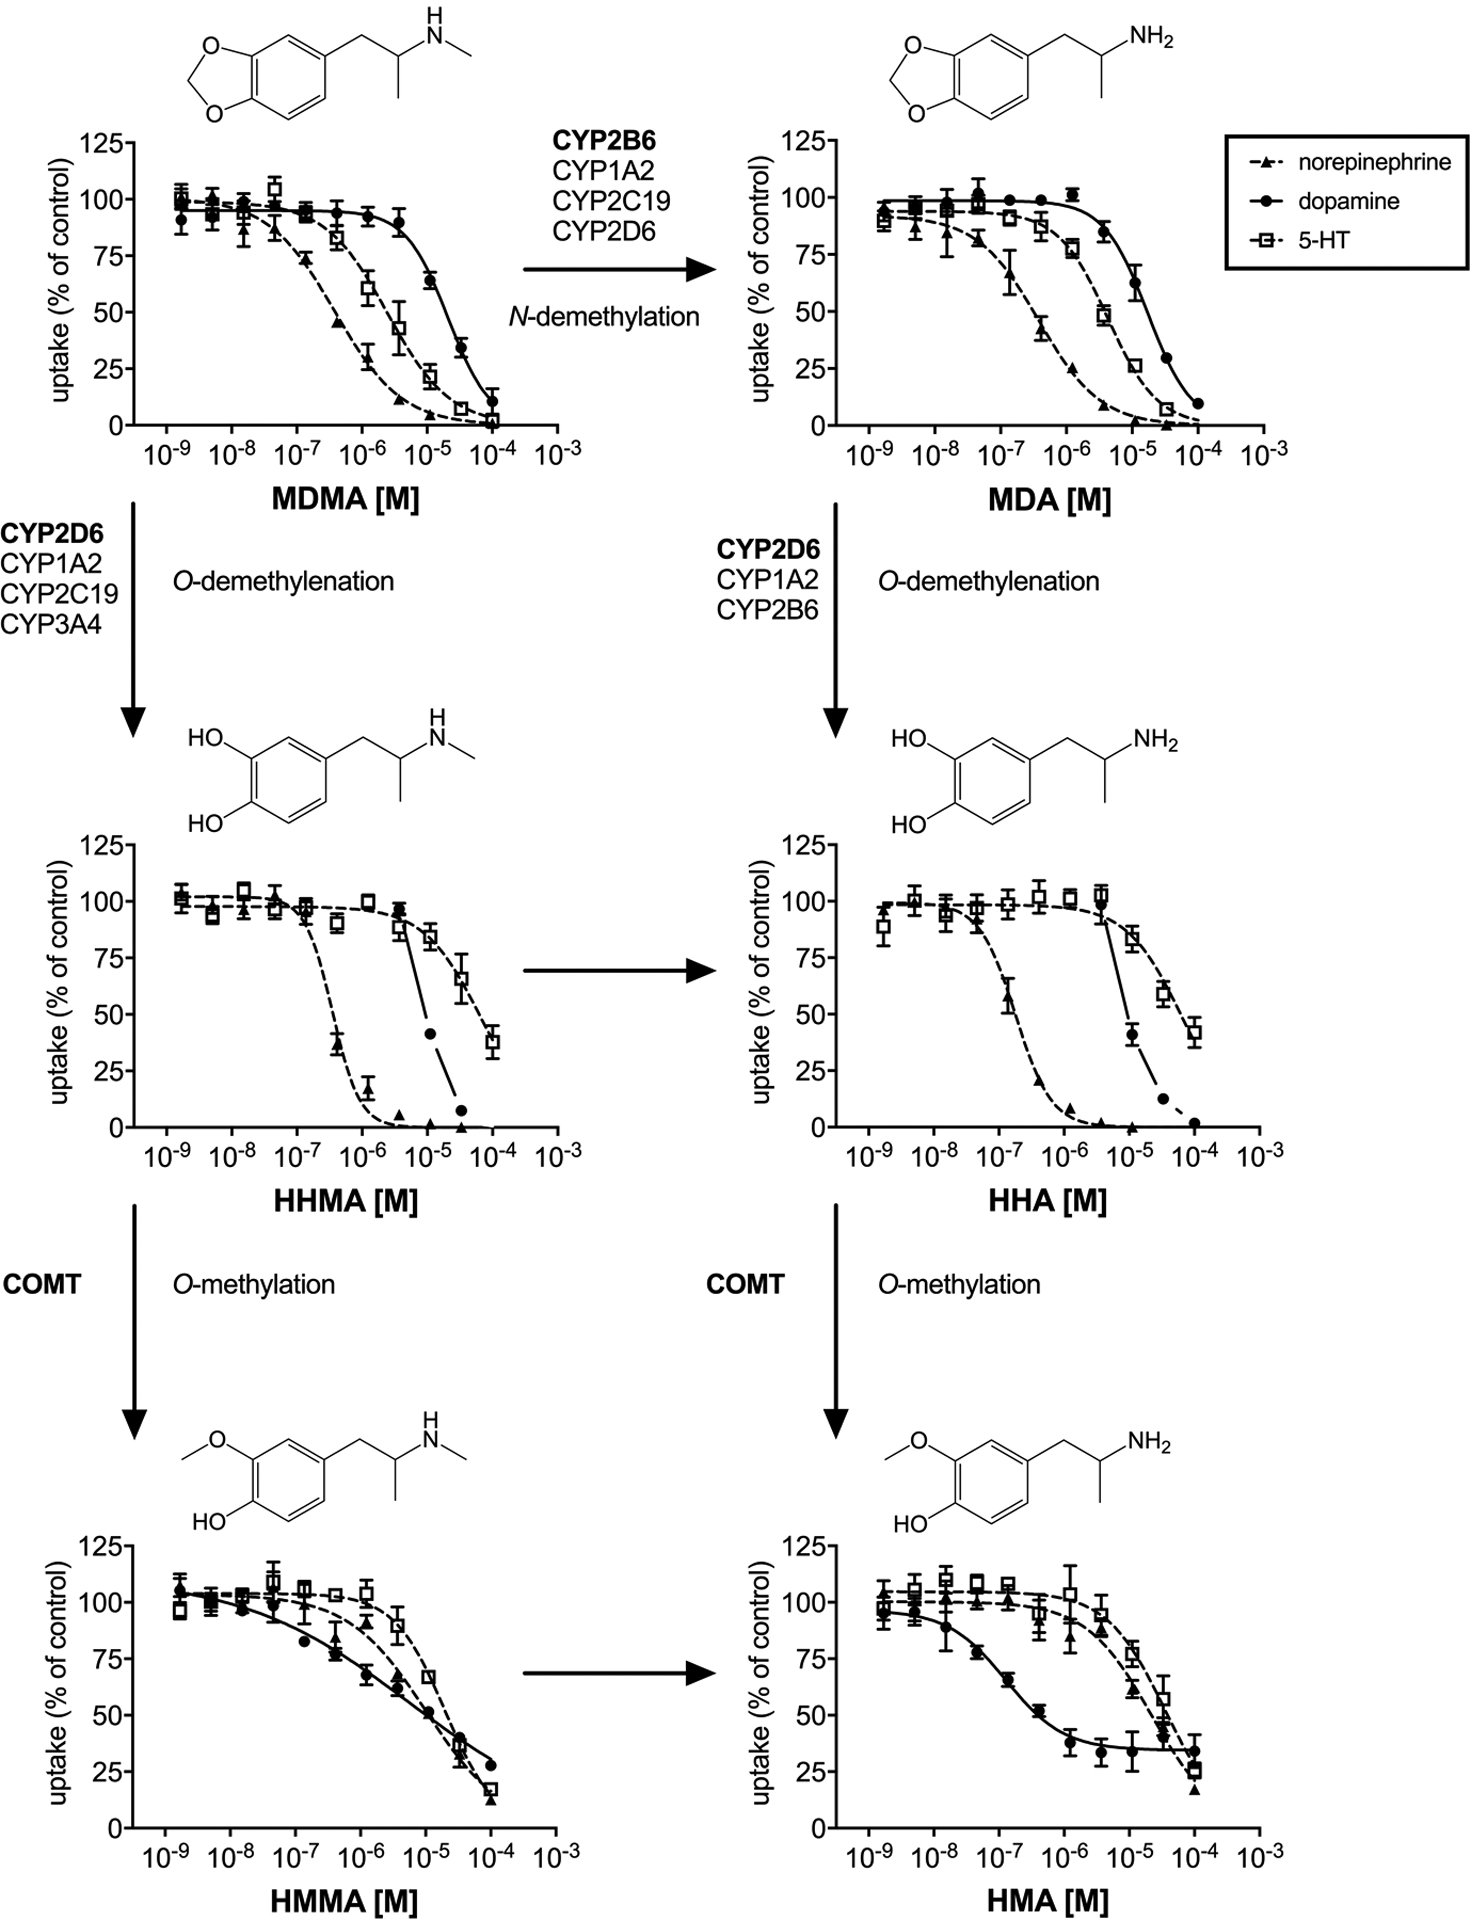
Major (bold) and minor enzymes involved in MDMA metabolism as described in (Meyer et al., 2008; Kreth et al., 2000). Monoamine uptake curves were fitted by non-linear regression and the data are presented as the mean±S.E.M. For HHMA and HHA no IC50 value was calculated for DAT, due to the lack of sigmoidal shape of the uptake curves. For these compounds, the DAT uptake curve intercept between 0 and 100% is shown in the figure for comparison and full curves are shown in Supplemental Figure S1.