
Figure 3. Metabolism of MDPV and corresponding monoamine uptake inhibition curves.
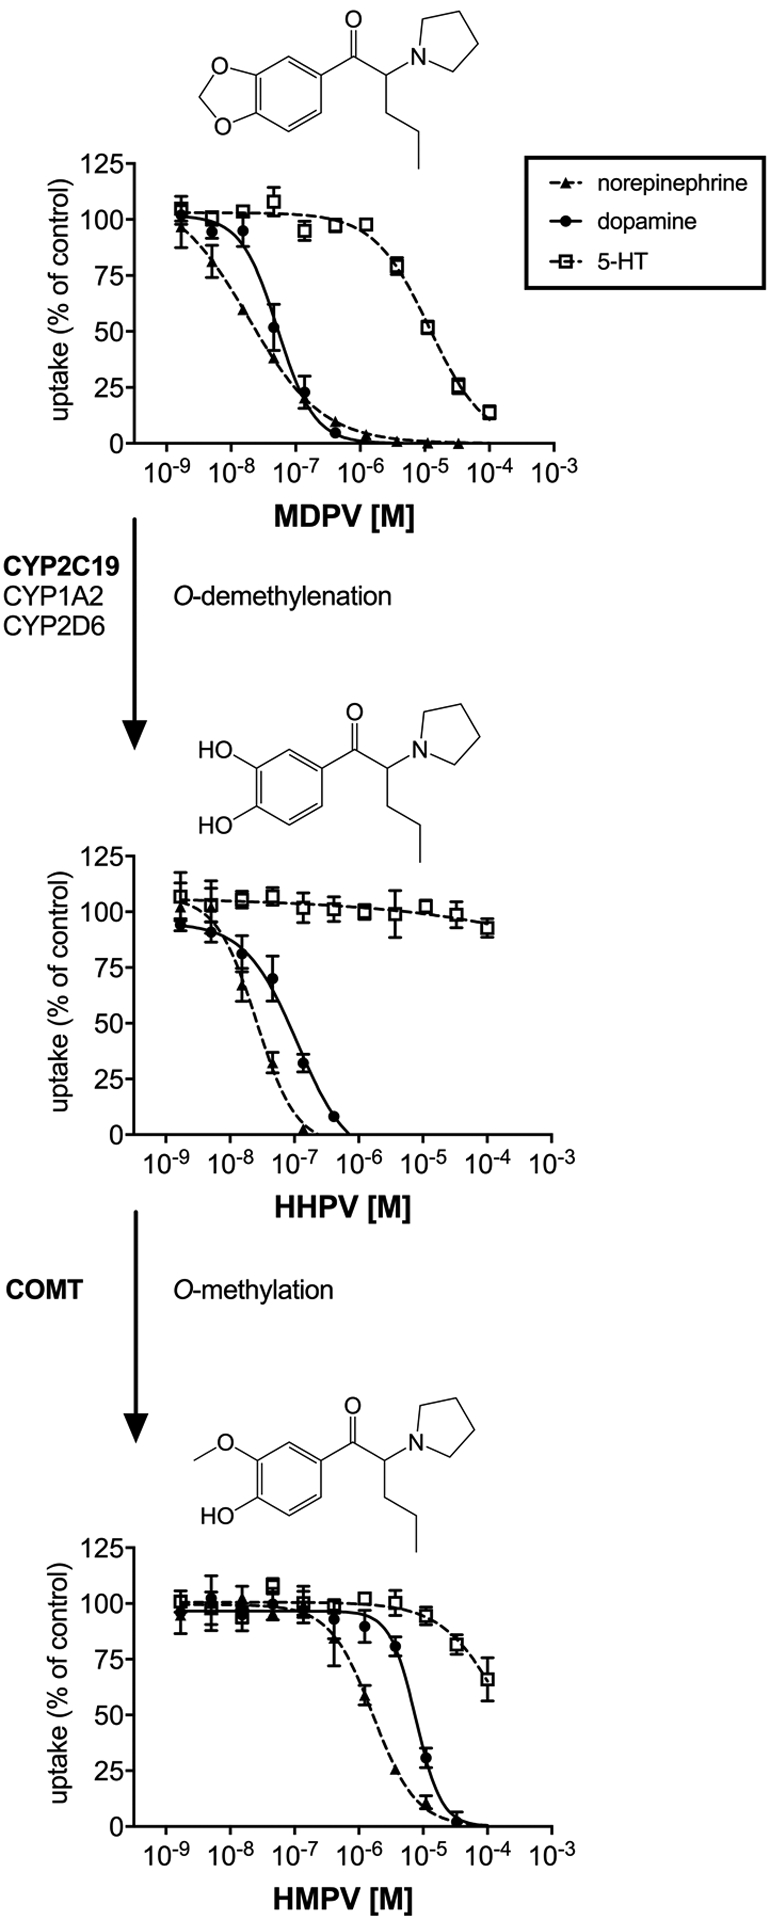
Major (bold) and minor enzymes involved in methylone metabolism as described in (Meyer et al., 2010). Monoamine uptake curves were fitted by non-linear regression and the data are presented as the mean±S.E.M.