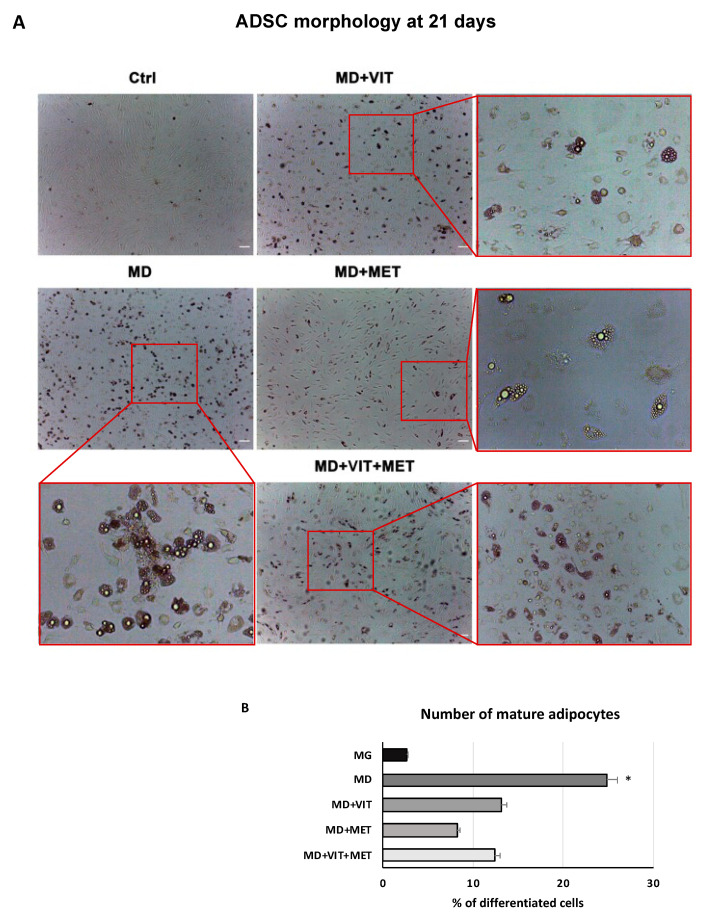
Figure 1.
Optical microscope analysis of ADSC morphology during differentiation: (A) Figure shows morphological changes in cells treated with adipogenic differentiation medium (MD), or in MD plus vitamin D (MD+VIT), or in MD plus metformin (MD+MET), or in MD with both metformin and vitamin D (MD+VIT+MET), as compared to control untreated cells (Ctrl). ADSCs cultured in adipogenic medium alone acquired the appearance of mature adipocytes (MD). Scale bar = 100 µm. (B) The number of mature adipocytes was calculated using ImageJ. Data are expressed as mean ± SD referred to the control (* p ≤ 0.05).

