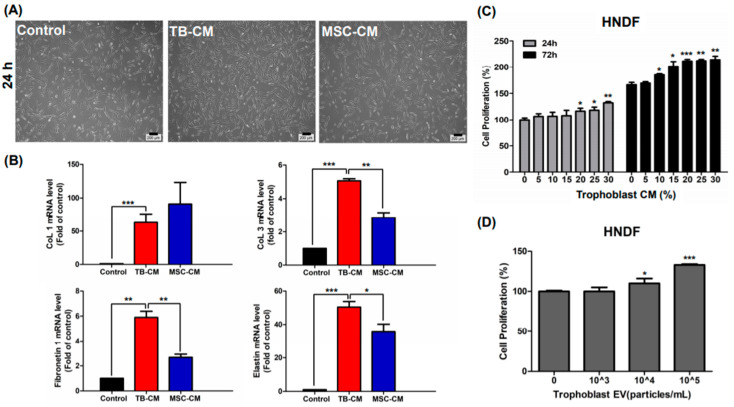
Figure 1.
TB-CM and TB-Exos induced proliferation of HNDFs. (A) HNDFs were treated with 20% TB-CM and MSC-CM for 24 h, followed by the estimation of the number of cells under a light microscope. Scale bar: 200 μm. (B) After treatment of HNDFs with 20% TB-CM and MSC-CM for 24 h, the cells were harvested and the relative mRNA levels of collagen type I and III, fibronectin 1, and elastin in the cells were quantified using quantitative RT-PCR analysis. (C) HNDF cells were treated with 0%, 5%, 10%, 15%, 20%, 25%, and 30% TB-CM, respectively. The cell viability was measured using CCK8 assay at 24 and 72 h. (D) HNDF cells seeded into a 96-well plate were treated with TB-Exos (1 × 10³, 1 × 10⁴, and 1 × 10⁵ particles/mL), following which the cells were cultured in growth medium for 24 h. Cell proliferation was determined using CCK8 assay. Data are represented as means and standard deviation (n = 3); * p < 0.05, ** p < 0.01, and *** p < 0.001, as compared to the corresponding control.

