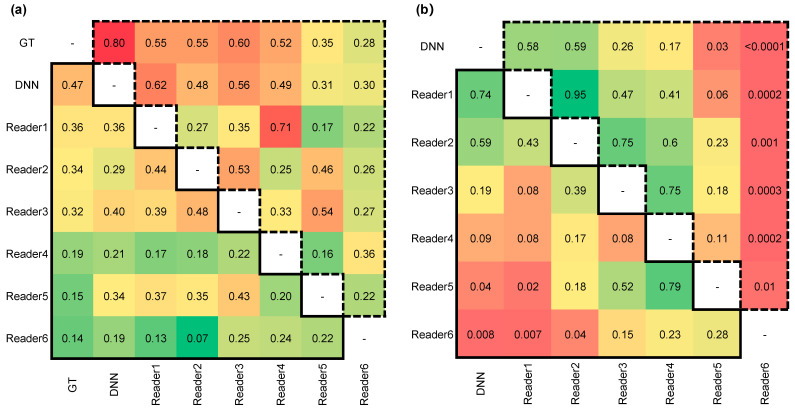
Figure 5.
The Cohen’s kappa values and p-values for DNN model and six readers. The statistical values contained in a solid line triangle on the bottom left corner represent Task1 testing results. The statistical values contained in a dashed line triangle on top right corner represent Task2 testing results. (a) The Cohen’s kappa values for two tasks. (b) The p-values for two tasks.

