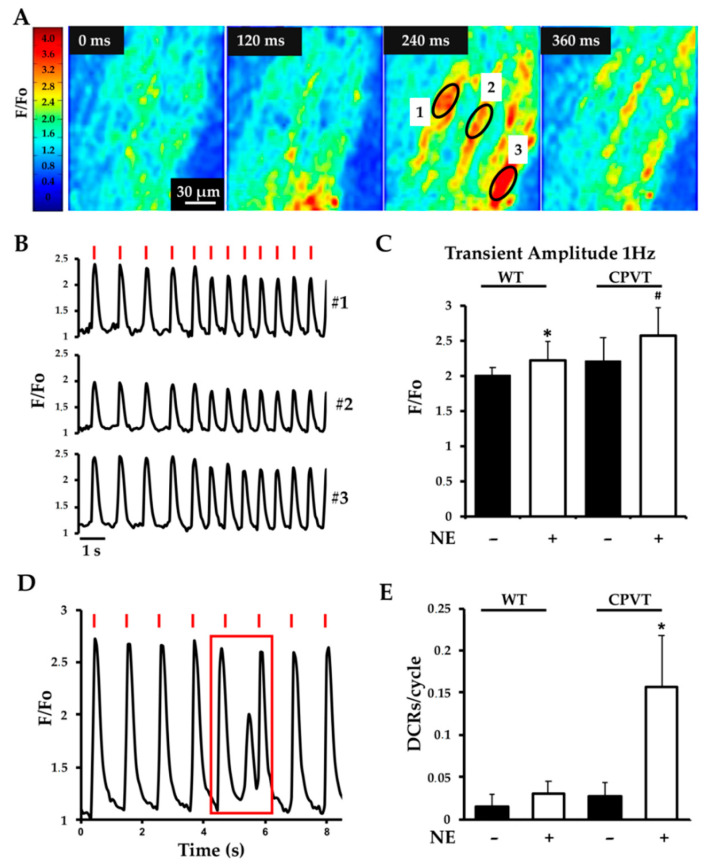
Figure 2.
Multiphoton Ca2+ imaging of Fluo-4-loaded myocardial slices. (A) Time course of Ca2+ fluctuations in a heart slice, showing rises in fluorescence intensity, represented in pseudocolor (see reference bar on the left margin of the panel) upon electrical stimulation. F/Fo, normalized fluorescence Ca2+ signal intensity. (B) Fluorescence intensity profile of three different cells (in A, 240 ms) showing synchronized changes during electrical field stimulation. Stimulation pulses are indicated by the red lines. (C) Quantification of Ca2+ transient amplitude, in both WT and CPVT heart slices, paced at 1 Hz, both in the absence (black bars) and in the presence (white bars) of norepinephrine (NE, 1 μM) (* p < 0.05 (WT vs. WT + NE); # p < 0.05 (CPVT + NE vs. WT + NE) n = 30 cells/condition). (D) Representative trace of spontaneous Ca2+ release events occurring between two consecutive beats (highlighted by the red box). (E) Quantification of SCRs in CPVT and WT slices, in unstimulated conditions and upon perfusion with NE (1 μM). Bars represent SD (* p < 0.05 compared to CPVT-NE; n = 40 cells for each group).

