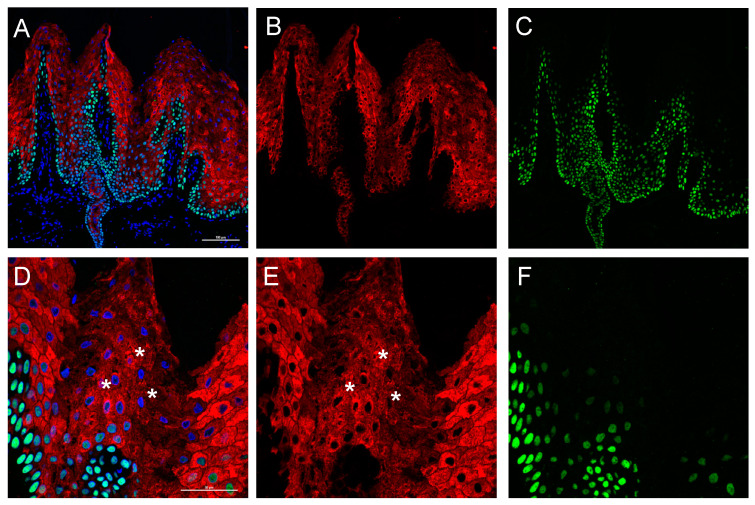
Figure 5.
Skin confocal immunofluorescence analysis. Staining for p63 (Green) and K1 (Red). (A) p63 and K1 staining merged with DAPI (Blue) (B) K1 single channel. (C) p63 single channel (A–C, 20× objective). (D) High magnification capture (60× objective) showing nuclear localization of p63 and K1 filament clumping (stars, please see high magnification capture furnished in Figure S1); scale bars = 50 μm. (E) K1 single channel. (F) p63 single channel. Immunofluorescence analysis for p63 and K1 antigens. P63 is identified using Alexa fluor®488 igG (FITC green fluorescence), laser at 488 nm and 525/50 band pass filter while K1 with Alexa fluor®568 igG (TRITC red fluorescence), laser at 561 nm and 595/50 band pass filter. Nuclei detection was performed using DAPI (Blu fluorescence), laser at 404 nm and 450/50 band pass filter.

