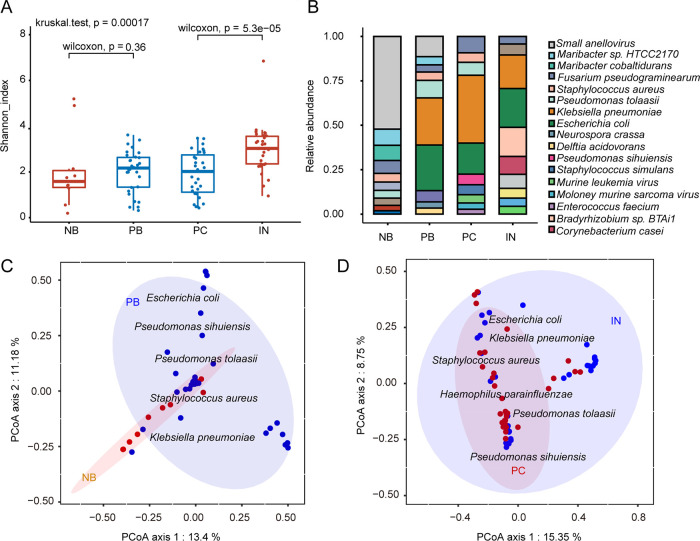
FIG 2.
Children with bacterial meningitis harbor a distinct microbiome. (A) Boxplots of microbial α-diversity measures (Shannon index) for blood from healthy controls (NB) and blood (PB), and CSF from BM patient (PC) and undiagnosed cases (IN). A two-sided Wilcoxon rank sum test and Kruskal-Wallis test were used to compute P values (Shannon and Simpson indexes; see also Fig. S1 in the supplemental material). (B) Species-level distribution of the microbiota in the four groups in CSF and plasma. The numbers of replicated samples in this figure are as follows: n = 10 for NB, n = 31 for PB, n = 31 for PC, and n = 30 for IN. (C) PCoA plot of the microbiota using the Bray-Curtis distance metric of β-diversity in the blood of meningitis patients and healthy controls. (D) The ellipses indicate the 95% confidence intervals. The text denotes the locations of the top contributing species, and weighted average scores were computed by the wascores function.

