FIG 3.
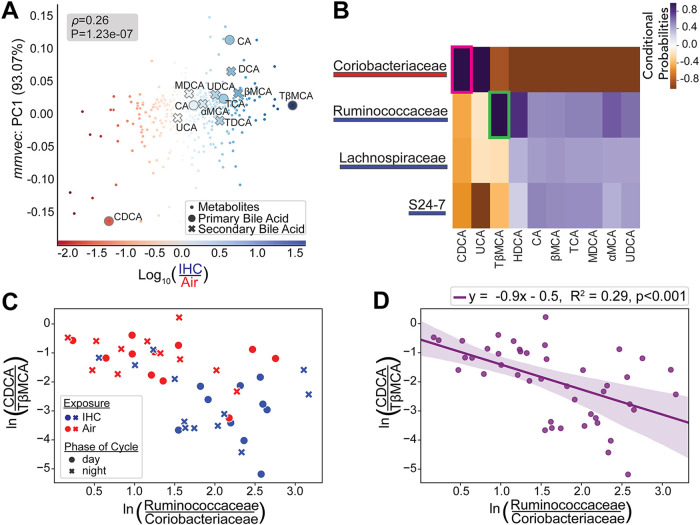
Microbes and metabolites with linked expression levels as determined by mmvec analysis. (A) mmvec (58) cooccurrence analysis (y axis) based on songbird (56) multinomial regression differential ranking analysis (x axis). Bile acids generally have level 1 identifications, except for cholic acid (CA), CDCA, and murideoxycholic acid (MDCA), which are level 3 annotations. (B) Log conditional probability heat map, organized using hierarchical clustering, with the top 4 differentially abundant microbial families and the top differentially abundant bile acids. Pink and green boxes highlight the top 2 points with the highest correlation values. (C) Log ratios of the top correlated microbes (x axis) and metabolites (y axis) identified in panel B. Microbial log ratios were determined as the number of all reads from sOTUs that belong to the family Ruminococcaceae divided by the number of all reads from sOTUs that belong to the family Coriobacteriaceae. Metabolite log ratios were determined as the raw values from CDCA divided by the raw values of TβMCA. (D) Linear regression plot using the same log ratios as the ones in panel C, with best-fit lines and shaded areas representing 95% confidence intervals. Log ratios are based on natural log. Control samples with exposure only to normal air conditions are in red (n = 4; 5 to 6 time points per mouse). Experimental samples exposed to IHC conditions are in blue (n = 4; 5 to 6 time points per mouse). Complete metadata can be found in Table S3 at https://doi.org/10.6084/m9.figshare.14614434.

