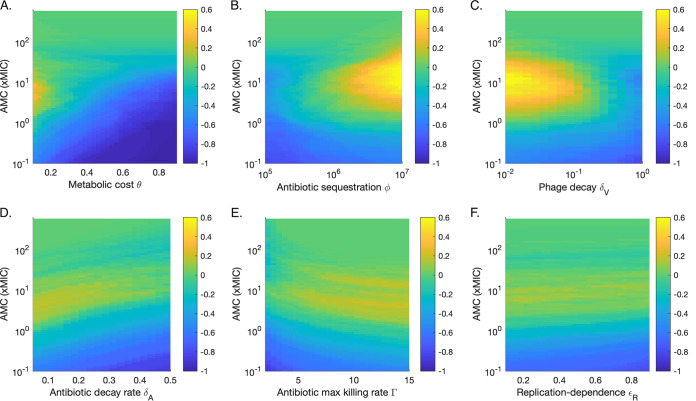
FIG 5.
Sensitivity analysis for six key parameters (see Fig. S1 in the supplemental material). Color represents the difference between the proportion of runs for which the density of the Pf+ strain exceeds that of the Pf− strain over the last day and the proportion of runs for which the opposite occurs. For example, a value of 0 indicates that as many runs were dominated by Pf+ as by Pf− strains. The density used for each run is the median density over the last day of antibiotic treatment. (A) Metabolic cost. (B) Antibiotic sequestration. (C) Phage decay rate. (D) Antibiotic decay rate. (E) Antibiotic maximum killing rate. (F) Replication dependence of antibiotics.

