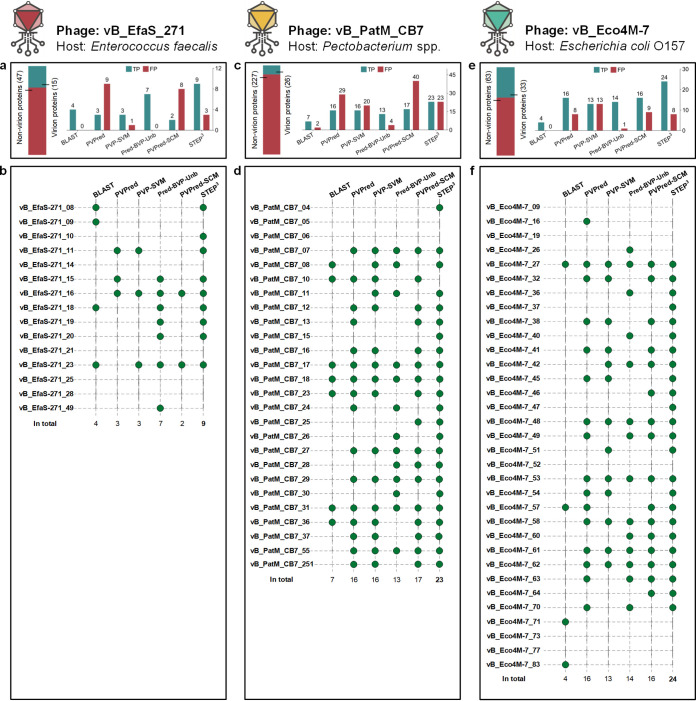
FIG 3.
Prediction details from STEP3 and other tools. (a) For phage vB_EfaS_271, horizontal bars denote the number of virion and nonvirion proteins. The bar chart shows the numbers of the virion proteins correctly retrieved as true-positive results (TP), i.e., confirmed by mass spectrometry (26), and nonvirion proteins mistakenly predicted as virion proteins (denoted by false-positive results [FP]). (b) For each protein in the phage vB_EfaS_271 virion defined by mass spectrometry, a green circle represents a successful hit by a predictor. (c) For phage vB_PatM_CB7, the bar chart shows the numbers of virion proteins correctly retrieved as TP and nonvirion proteins mistakenly predicted as FP. (d) Detailed predictions from STEP3 and other tools for vB_PatM_CB7 virion proteins defined by mass spectrometry (27). (e) For phage vB_Eco4M-7, the bar chart shows the numbers of virion proteins correctly retrieved as TP and nonvirion proteins mistakenly predicted as FP. (f) Detailed predictions from STEP3 and other tools for vB_PatM_CB7 virion proteins defined by mass spectrometry (28).

