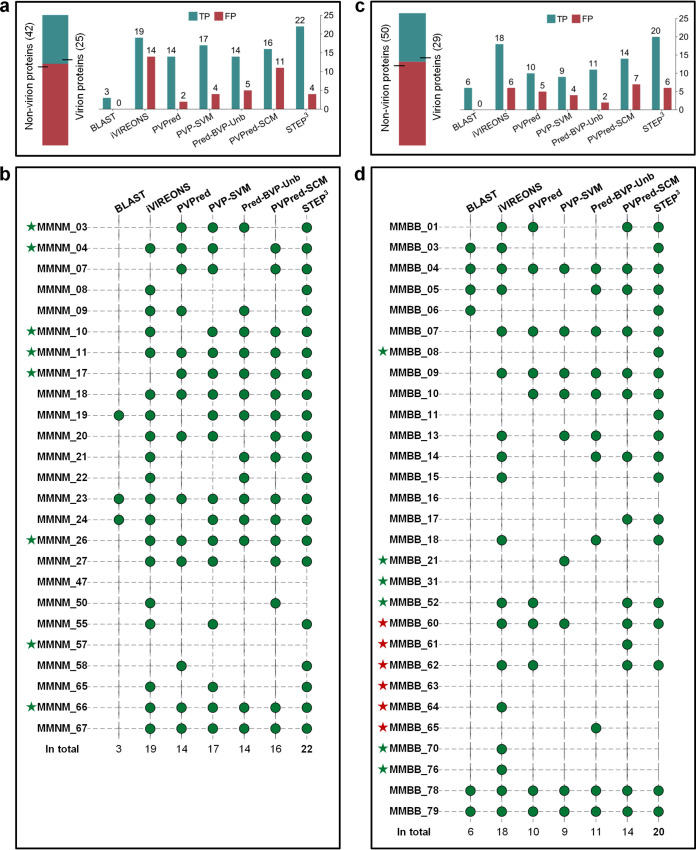
FIG 6.
Prediction details from STEP3 and other tools applied to MMNM and MMBB. (a) The statistics of the prediction results on MMNM. Horizontal bars on top describe the number of virion and nonvirion proteins in the phage isolates. The bar chart shows the numbers of virion proteins correctly retrieved (denoted by true-positive results [TP], i.e., confirmed by mass spectrometry) and nonvirion proteins mistakenly predicted as virion proteins (denoted by false-positive results [FP]). (b) Detailed predictions from STEP3 and other tools for MMNM for the virion proteins defined by mass spectrometry. The green circles represent a successful hit by a predictor. The green stars denote the proteins that have not previously been identified in phages. The red stars denote those with activities that have previously been identified in phages but not previously found as protein components of purified virions. (c) Prediction statistics for MMBB. (d) Detailed predictions from STEP3 and other tools for MMBB virion proteins defined by mass spectrometry.

