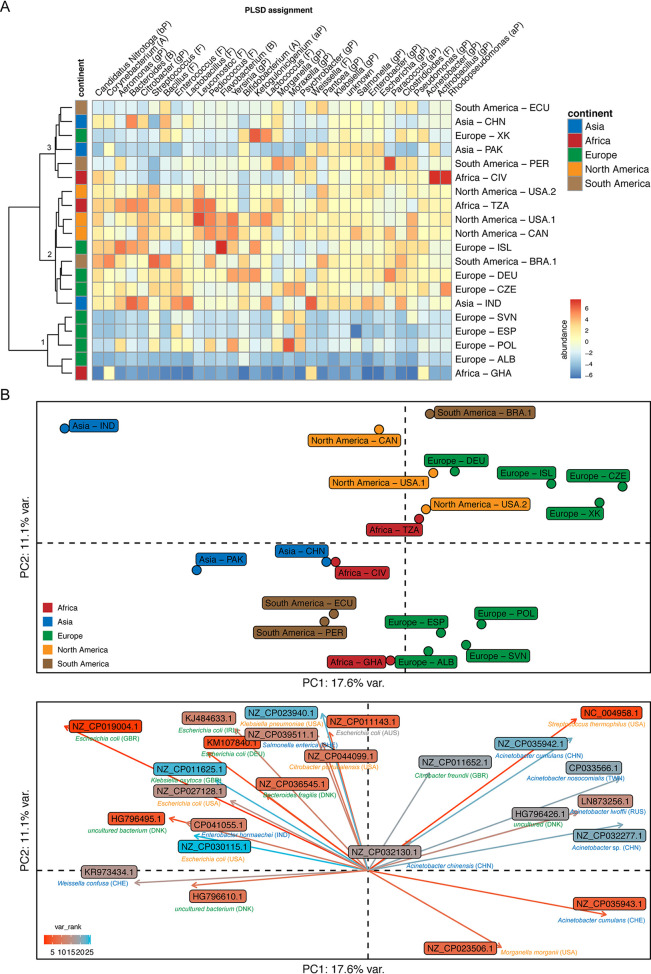
FIG 3.
Comparison of candidate plasmids from global sewage with known plasmids in the plasmid database (PLSDB). (A) Heat map of centered log ratio (clr)-transformed abundancies of plasmid candidates assigned to plasmids in the PLSDB at the bacterial genus level. The phylum level is indicated by letters in in parentheses: A, Actinobacteria; B, Bacteroidetes; aP, Alphaproteobacteria; bP, Betaproteobacteria; gP, Gammaproteobacteria; F, Firmicutes. Clustering of samples was performed using the Euclidean distances of the clr-transformed values. (B) Principal-component analysis of clr-transformed abundancies of known plasmids detected by the PLSDB. The plot at the top reveals similarities and differences between samples. The plot at the bottom reveals the known plasmids that drive the partitioning of the samples, with 17.6% of the variation explained by the first and 11.1% by the second principal component.

