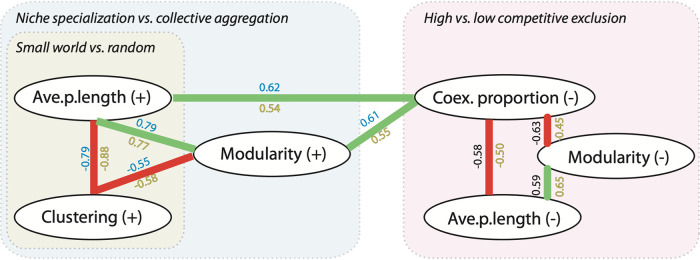
FIG 3.
Relationships between network properties. Positive (green) and negative (red) relationships between network properties were obtained based on Spearman’s r correlations > |0.5| in at least one country and P < 0.01. Cooccurrences (+) and coexclusions (−) are depicted. Relationships within metawebs for Spanish samples have r values in blue, and relationships within metawebs for the U.S. samples have r values shown in yellow. Interpretation of the properties and their associations are indicated in boxes: small-world versus random networks, niche specialization versus mixed communities, and high versus low competitive exclusion. Values for relationships between properties in a large-scale continental metaweb (merging U.S. and Spain databases) follow similar trends with the following values (Spearman’s r correlations > |0.5| and P < 0.01): Ave.p.length (+) and Clustering (+) = −0.88; Ave.p.length (+) and Modularity (+) = 0.78; Clustering (+) and Modularity (+) = −0.59; Coexclusion (Coex.) proportion (−) and Ave.p.length (−) = −0.50; Coex. proportion (−) and Modularity (−) = −0.58; Modularity (−) and Ave.p.length (−) = 0.74.

