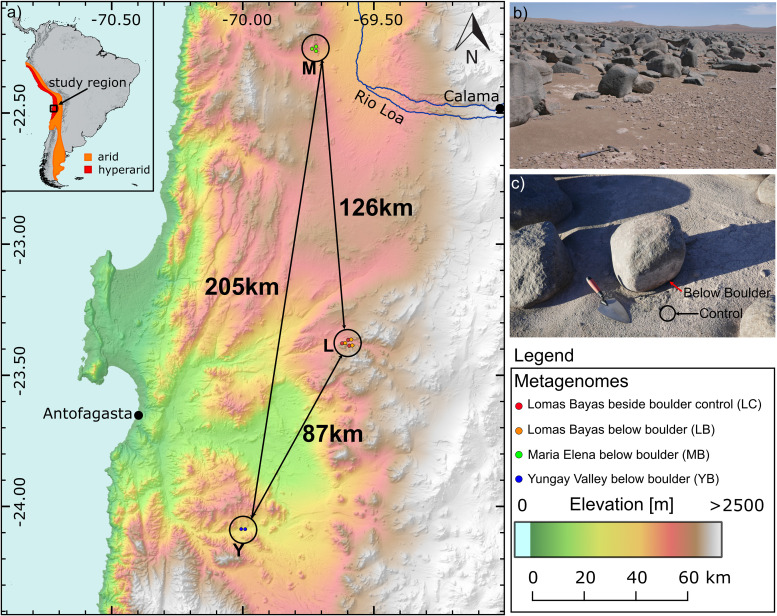
FIG 1.
Sampling location information. (a) Map of the sampling locations M (Maria Elena), L (Lomas Bayas), and Y (Yungay Valley). Distances between sampling locations are shown. The number of metagenome samples per location is shown in circles. (b) Yungay boulder field. (c) A sampled boulder in Maria Elena boulder field. Red and black arrows indicate sample types B and C, respectively. The map was made using ASTER Global Digital Elevation Model (104).

