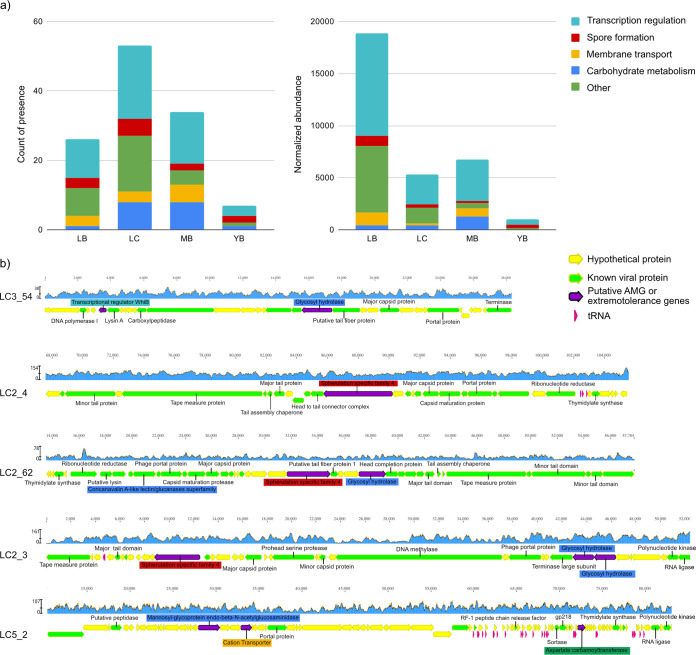
FIG 5.
Extremotolerance and auxiliary metabolic genes. (a) Sums of counts of presence (left) and normalized abundance (right) of putative extremotolerance genes and AMGs across sampling sites. Abundances were calculated using the coverage of scaffolds where the gene was found and normalized across samples by sequencing depth. (b) Genomic neighborhoods of putative extremotolerance genes and AMGs. Genes of interest are colored purple, and labels are color coded by the functional categories according to the color scheme used in panel a. Identified viral genes are labeled and colored green, while gene homologs to a viral protein in the DRAM-v (47) database without a known function are colored green without a label. Genes of uncharacterized function and tRNAs are in yellow and pink, respectively. Coverages calculated based on mapped reads are shown in the blue graph above each genomic region visualized with Geneious v11.1.5.

