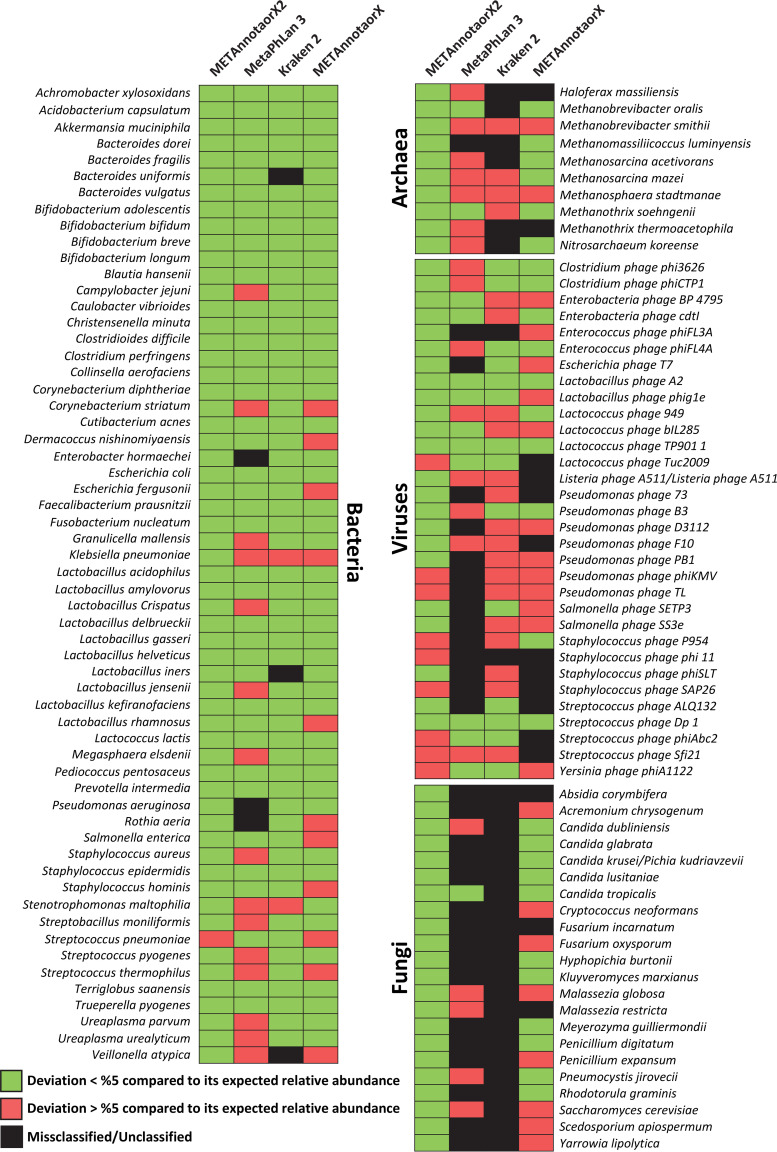
FIG 2.
Evaluation of species-level classification accuracy based on analysis of the nine artificial data sets. The four different heatmaps show the performance of METannotatorX2, MetaPhlAn 3, Kraken 2, and METAnnotatorX tools in profiling the species used to generate the nine artificial data sets. The black color indicates that the species was undetected or misclassified, the green color means that the species was profiled with a deviation of <5% compared to its expected relative abundance. The red color means that the species was profiled with a deviation of >5% compared to its expected abundance.

