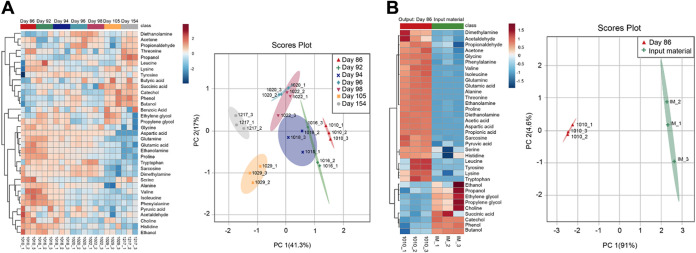
FIG 6.
Targeted metabolomics analysis using MetFish in injected and produced fluids from hydraulic fracturing. (a) Quantification of 37 metabolites identified by targeted MetFish analysis. (b) Comparison of metabolite levels in the input material and spent fracking fluid. Data shown are from replicate analysis (n = 3) of each fluid sample. Heatmaps were generated using MetaboAnalyst 3.0 (67), using Pearson’s distance measure and average linkage for the clustering algorithm.

