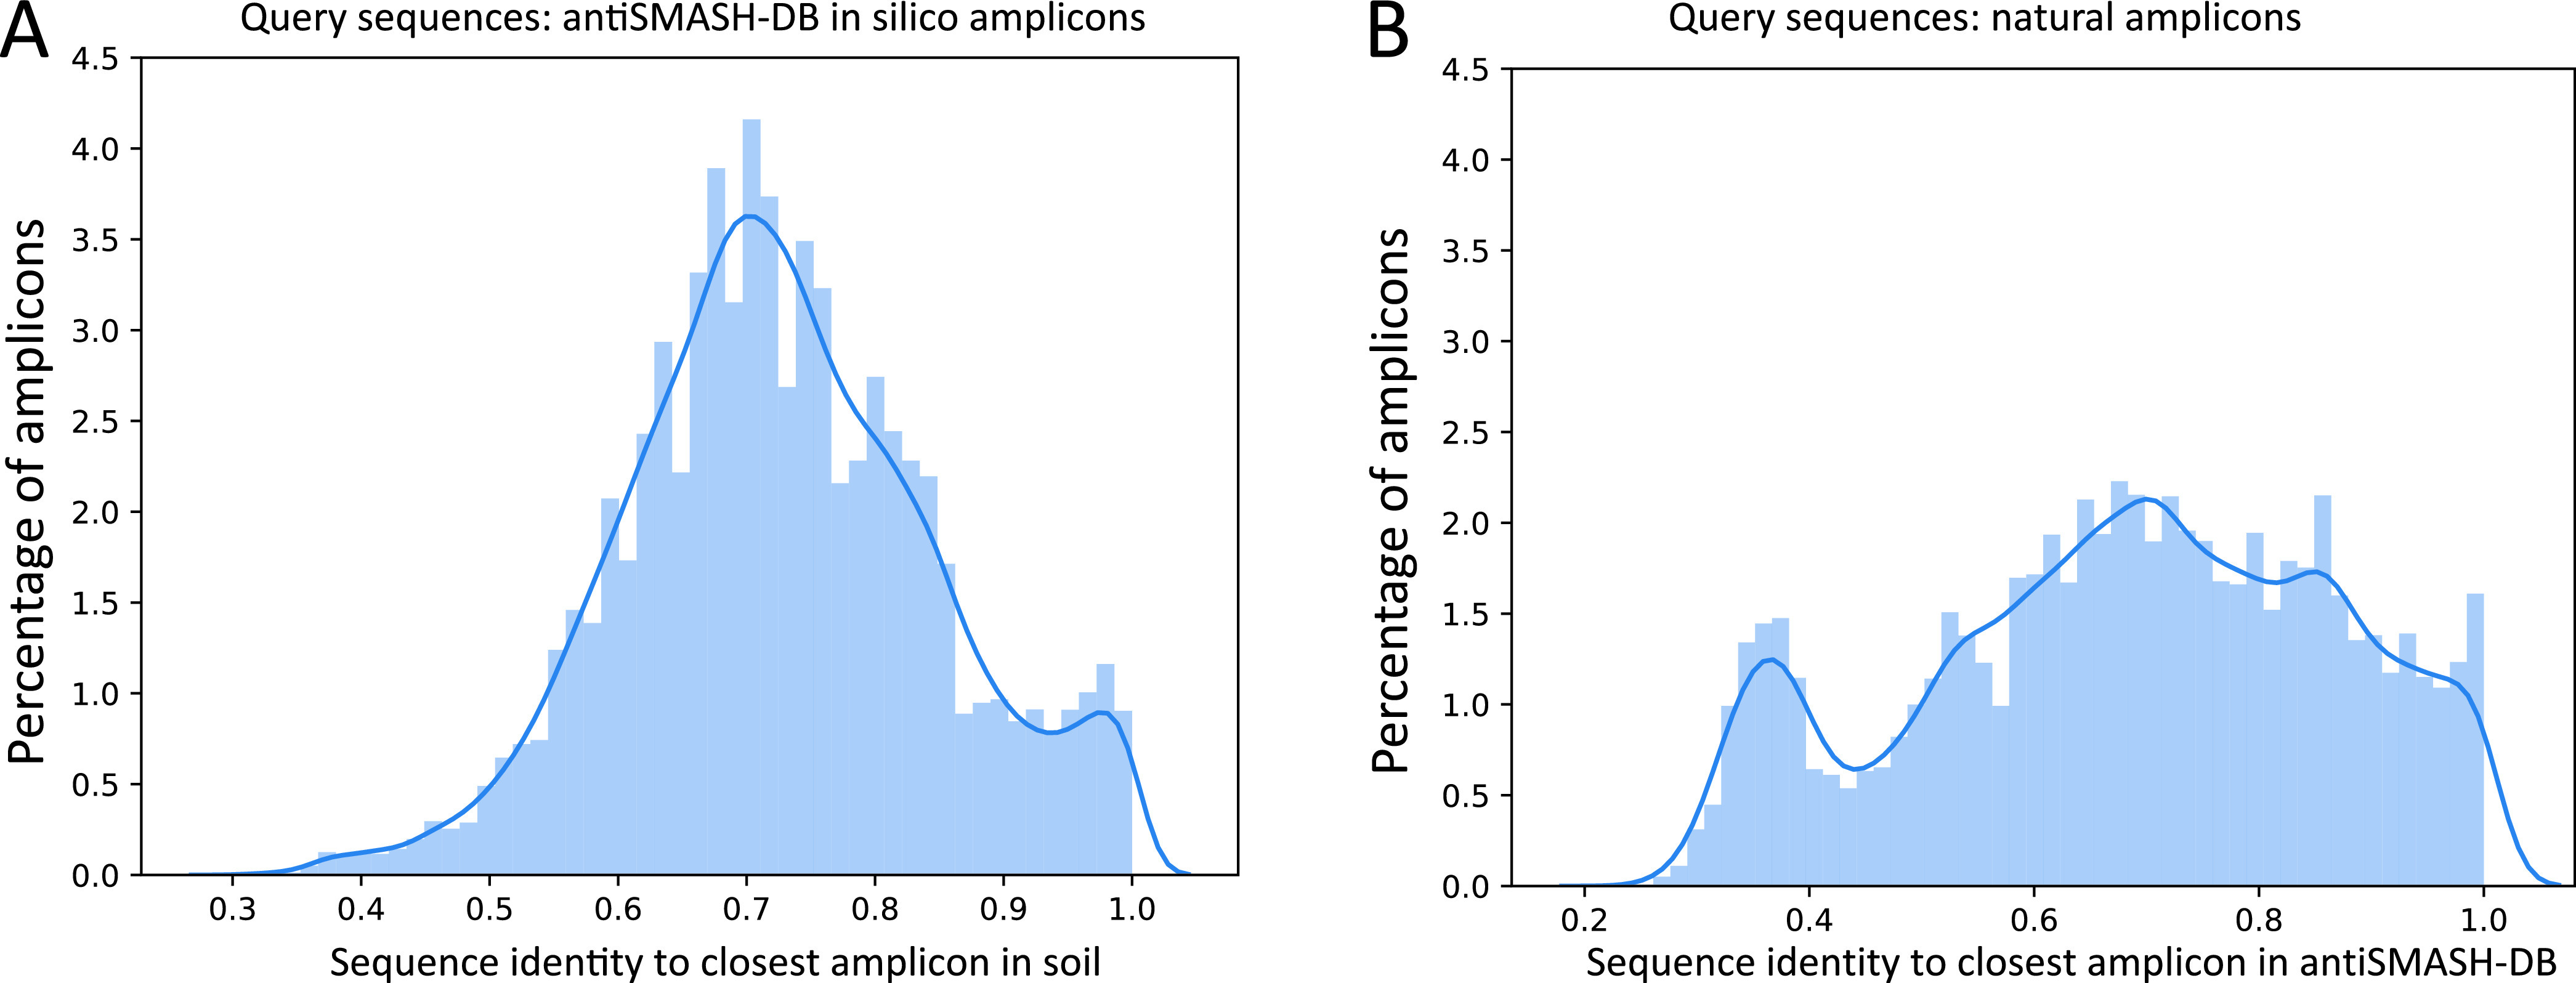
FIG 2.

Sequence distance between nAMPs and antiSMASH-DB in silico amplicons. (A) Histogram showing the distribution of best matches (highest percentage identity at protein level) between each nAMP and the antiSMASH-DB in silico amplicon database. (B) Histogram showing the distribution of best matches (highest percentage identity at protein level) between each antiSMASH-DB in silico amplicon and the nAMPs.
