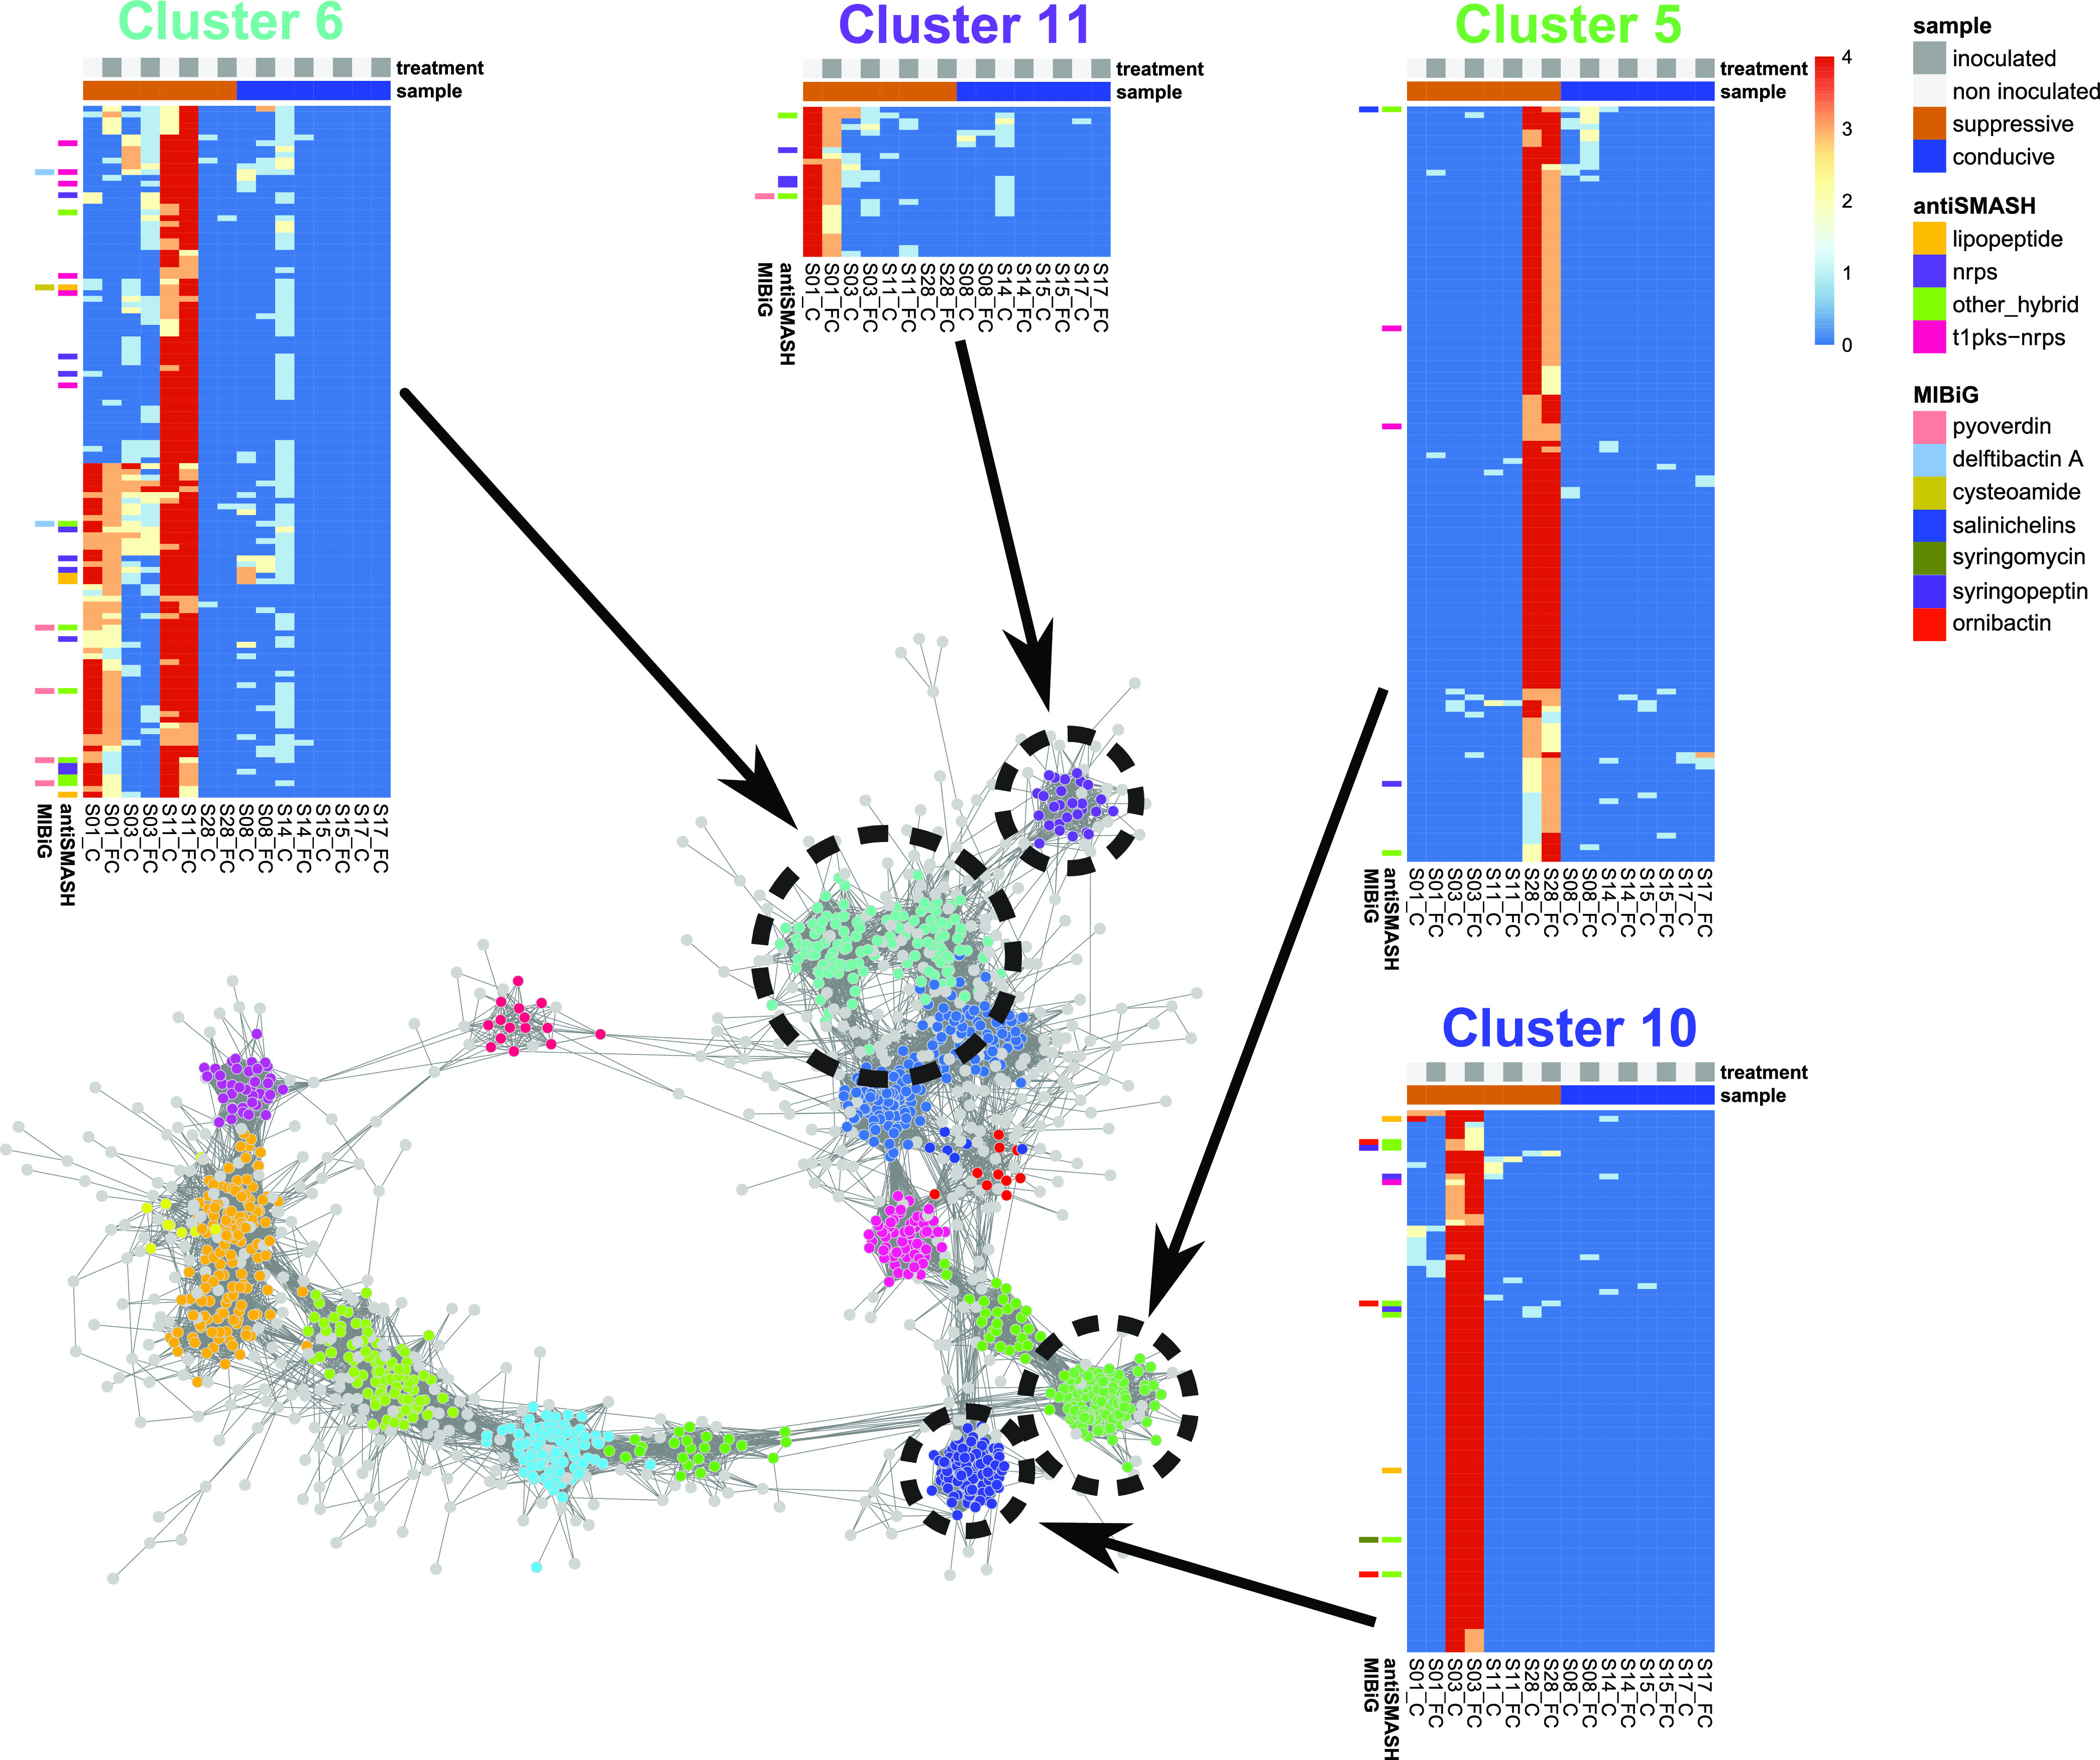
FIG 5.

Domain co-occurrence network showing clusters associated with soil suppressiveness. For each of the four clusters (5, 6, 10, and 11), a heat map shows the distribution of A domains across the samples. The heat map color scale represents the numbers of replicates in which the A domain occurred (from dark blue [absent] to red [present in all four replicates]). Upper color bars in the heat maps describe samples: light gray, noninoculated; dark gray, inoculated with pathogen and disease suppressiveness; orange, suppressive; blue, conducive. The left side of each heat map shows which A domains were annotated using the MIBiG or antiSMASH databases with color bars. Color of the bars indicates a compound or compound class shown in the legend.
