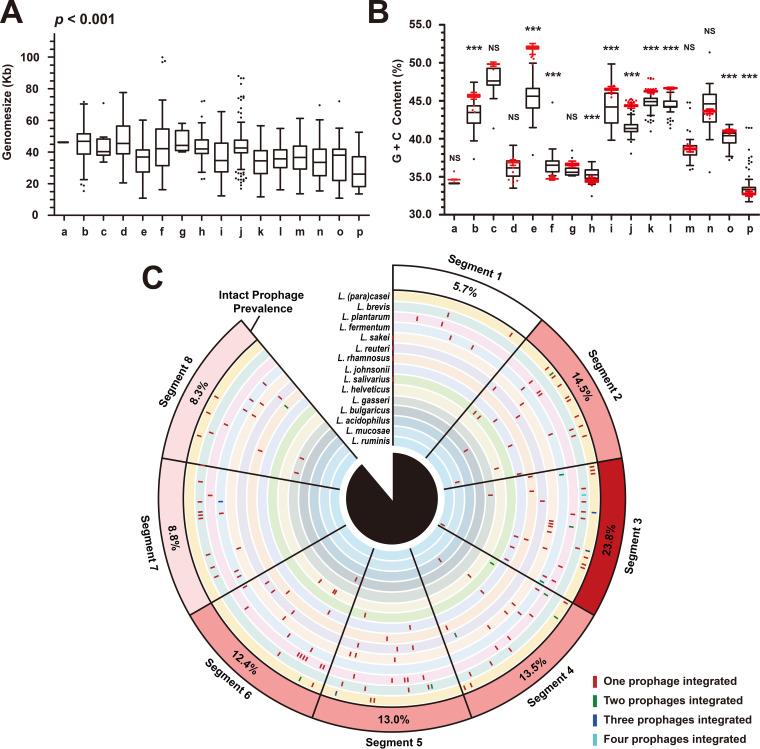
FIG 2.
General genome features and integration sites of Lactobacillus prophages. (A) Genome size of prophages. (B) GC content of prophages (black box plot) and their hosts (red box plot). The groups labeled a to p represent prophages belonging to 16 species of Lactobacillus genus, a, L. acidophilus; b, L. brevis; c, L. bulgaricus; d, L. crispatus; e, L. fermentum; f, L. (para) gasseri; g, L. helveticus; h, L. johnsonii; i, L. mucosae; j, L. (para)casei; k, L. plantarum; l, L. reuteri; m, L. rhamnosus; n, L. ruminis; o, L. sakei; p, L. salivarius. Each group of data in panels (A) and (B) used Tukey’s HSD test for plotting the whiskers and outliers. The genome sizes of prophages in 16 groups were compared using the nonparametric test for multiple independent samples—the Kruskal-Wallis test. The GC content of prophages and host bacteria in each group were compared using two independent samples t test (n < 30) or z test (n ≥ 30), as appropriate. Two-tailed P values were calculated, NS, P > 0.05; *, 0.01 < P ≤ 0.05; ***, P ≤ 0.001. (C) Prophage integration sites within Lactobacillus genomes. At least one complete genome was available from 15 Lactobacillus genomes. The names of the bacterial genomes used for analysis are provided in Data Set S1, Tab1, and the data of integration sites are provided in Table S2.

