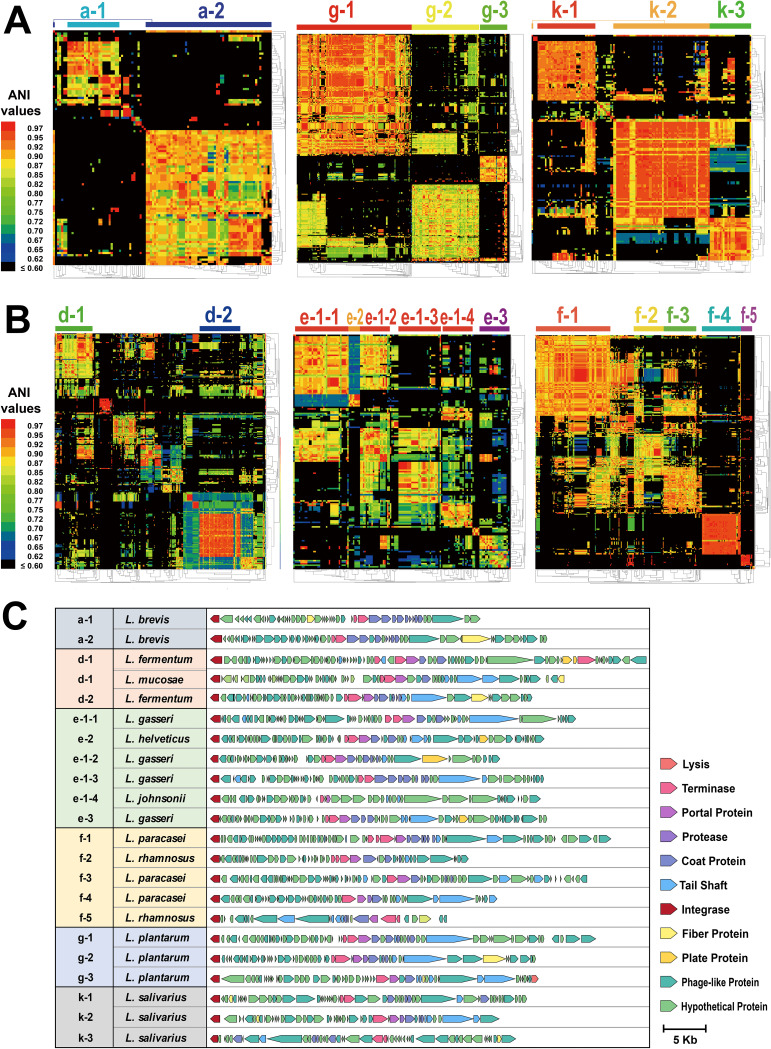
FIG 4.
Lactobacillus prophages vary greatly. (A) Clustering of pairwise ANI values across prophages of six clusters. The average-linkage hierarchical cluster method based on Pearson distance was used to cluster rows and columns in all clusters. The subclusters are graphed by color bars and labels at the top of heat maps. The colors in the heat map represent values with a gradient from blue (low identity) to red (high identity). The name orders of prophages on the top of each cluster (from left to right) are listed in Data Set S1, Tab2. (B) Genomic organization of representative intact prophages from different subclusters. Each gene is colored based on the known or putative function.

