
FIG 3.
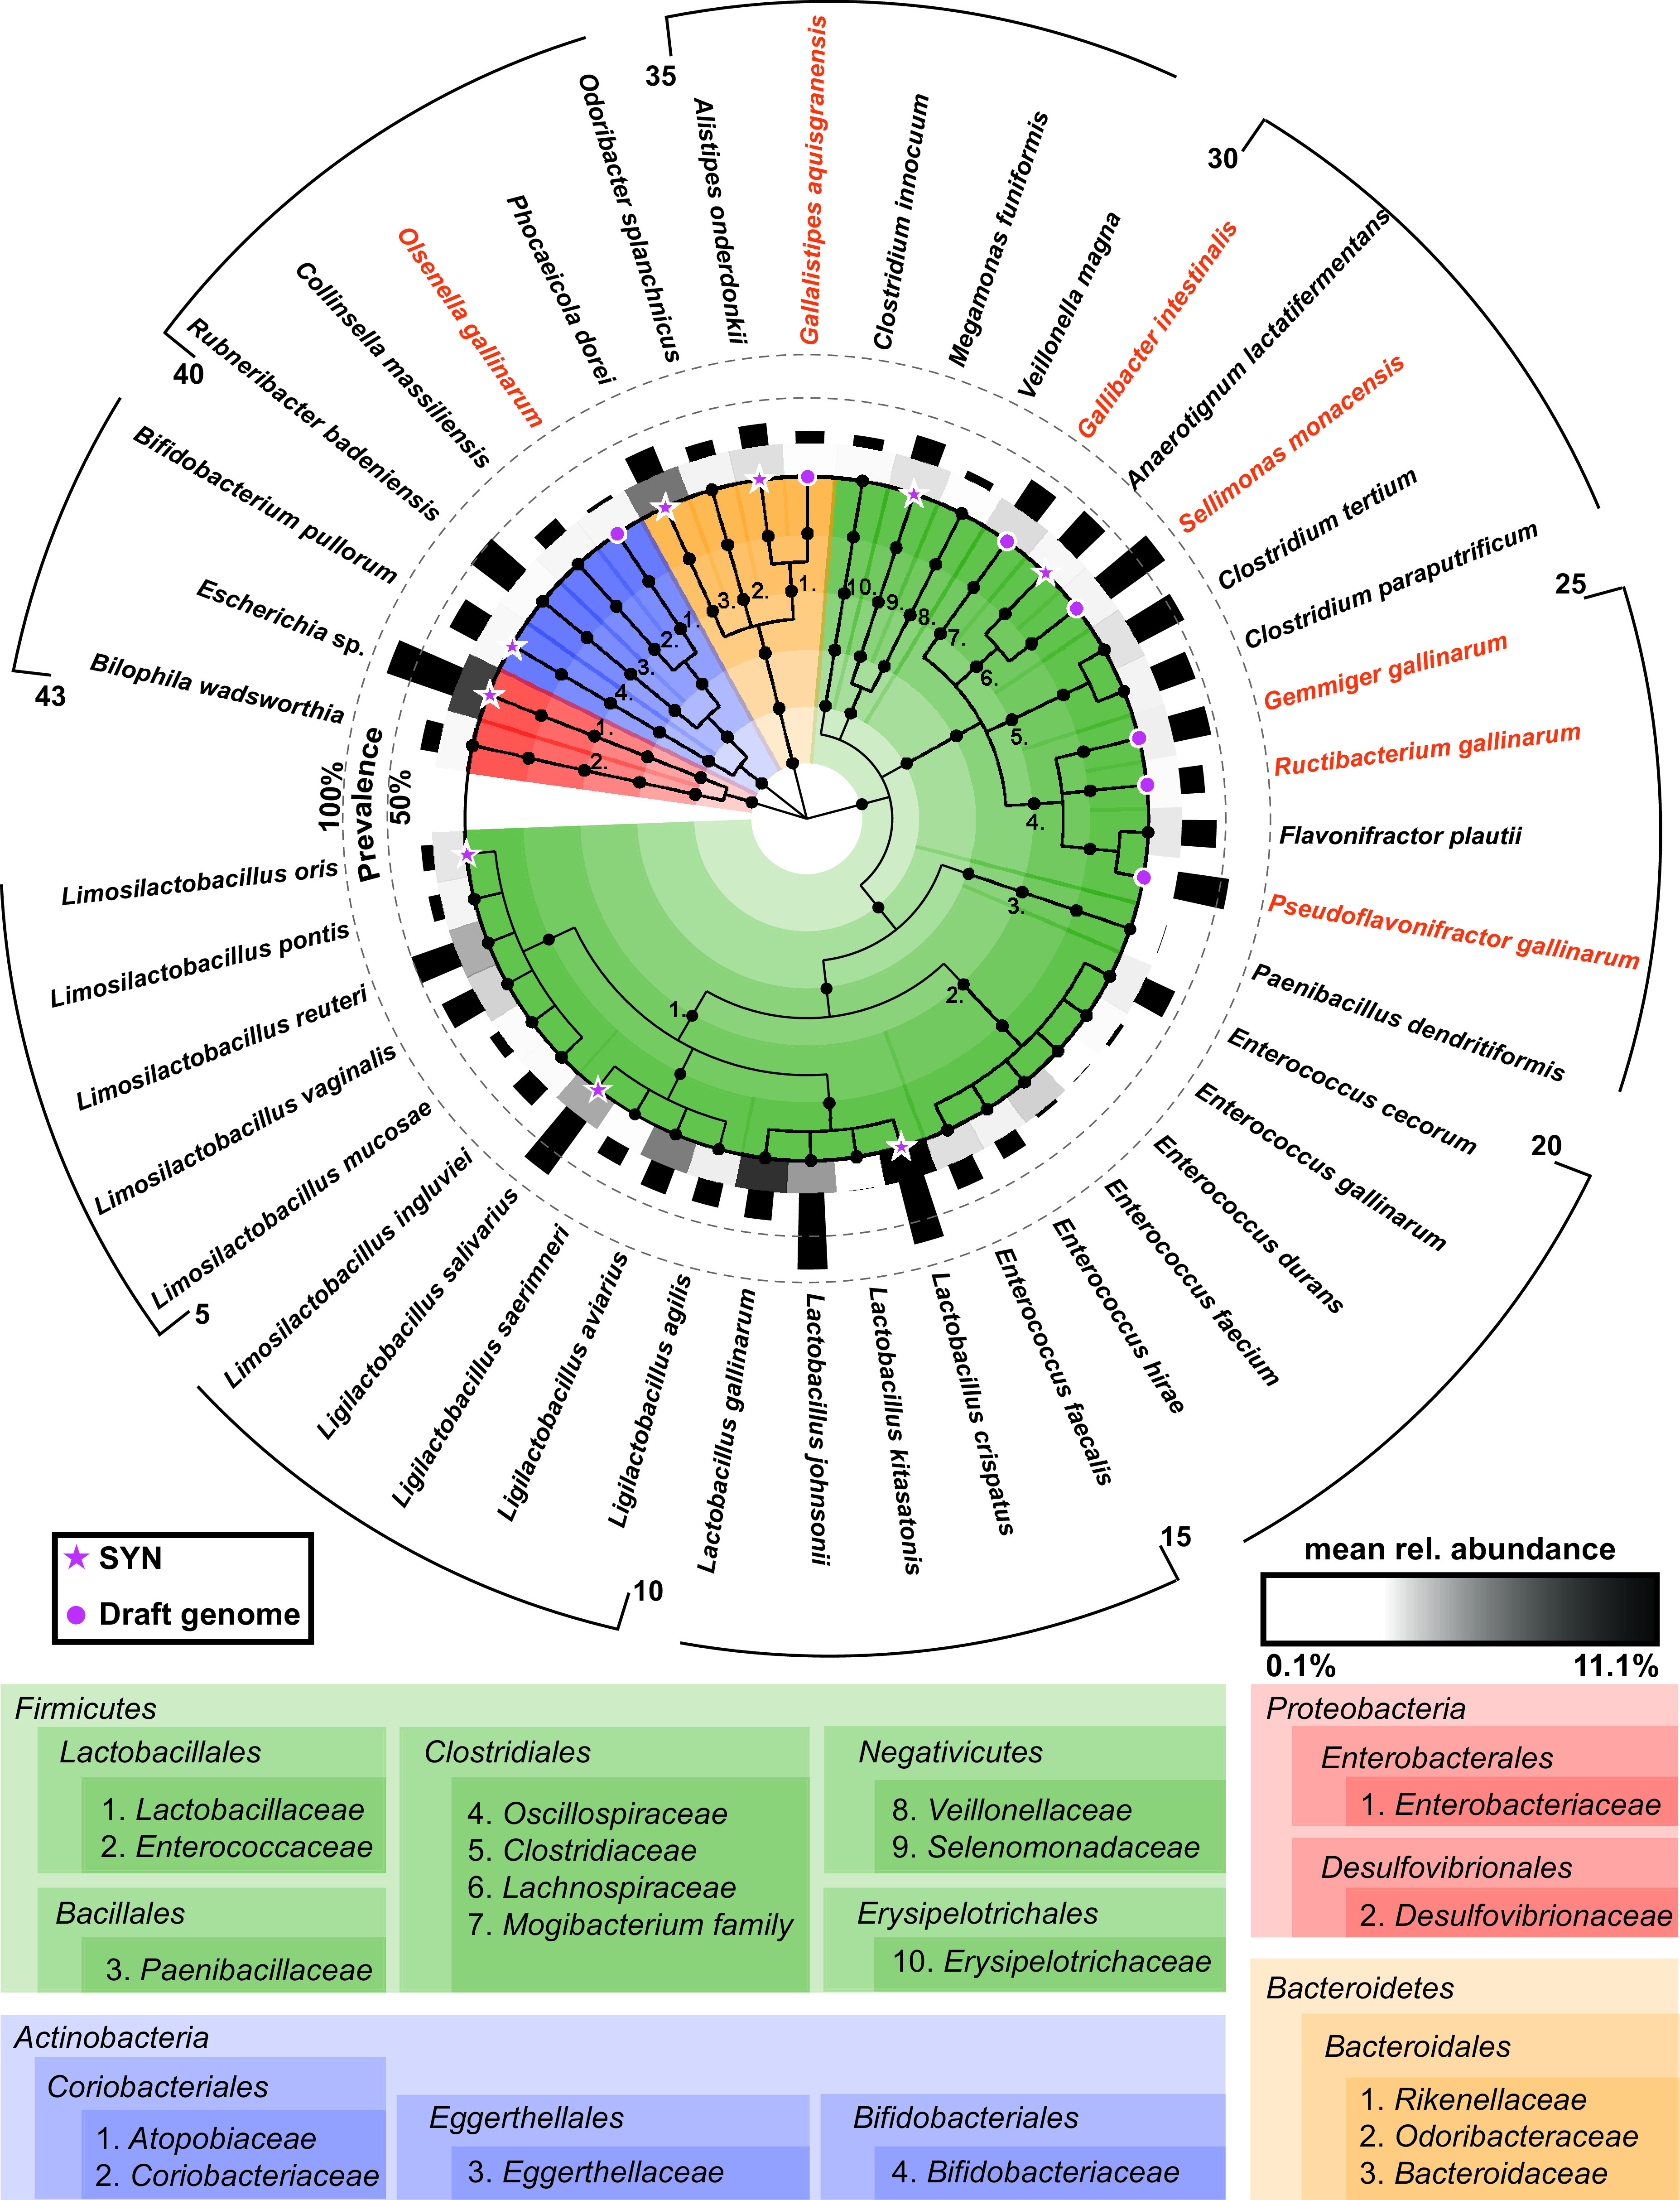
Diversity within the Chicken intestinal Bacterial Collection (ChiBAC). The cladogram shows all 43 isolates sorted according to their taxonomic classification. The colors correspond to phyla as indicated below the cladogram. Numbers indicate families within each phylum. Novel taxa described in the present study with their candidate names are indicated in orange. Isolates for which a draft genome was generated are indicated with a purple symbol (dots and stars). Stars indicate the strains selected to build the synthetic community (SYN). The gray scale in the inner circle depicts the average relative abundance of each isolate in 16S rRNA gene amplicon samples positive for the given species out of 1,499 chicken gut samples tested in total. Black bars in the inner circle next to the gray scales show the prevalence of each species, i.e., the number of positive samples.