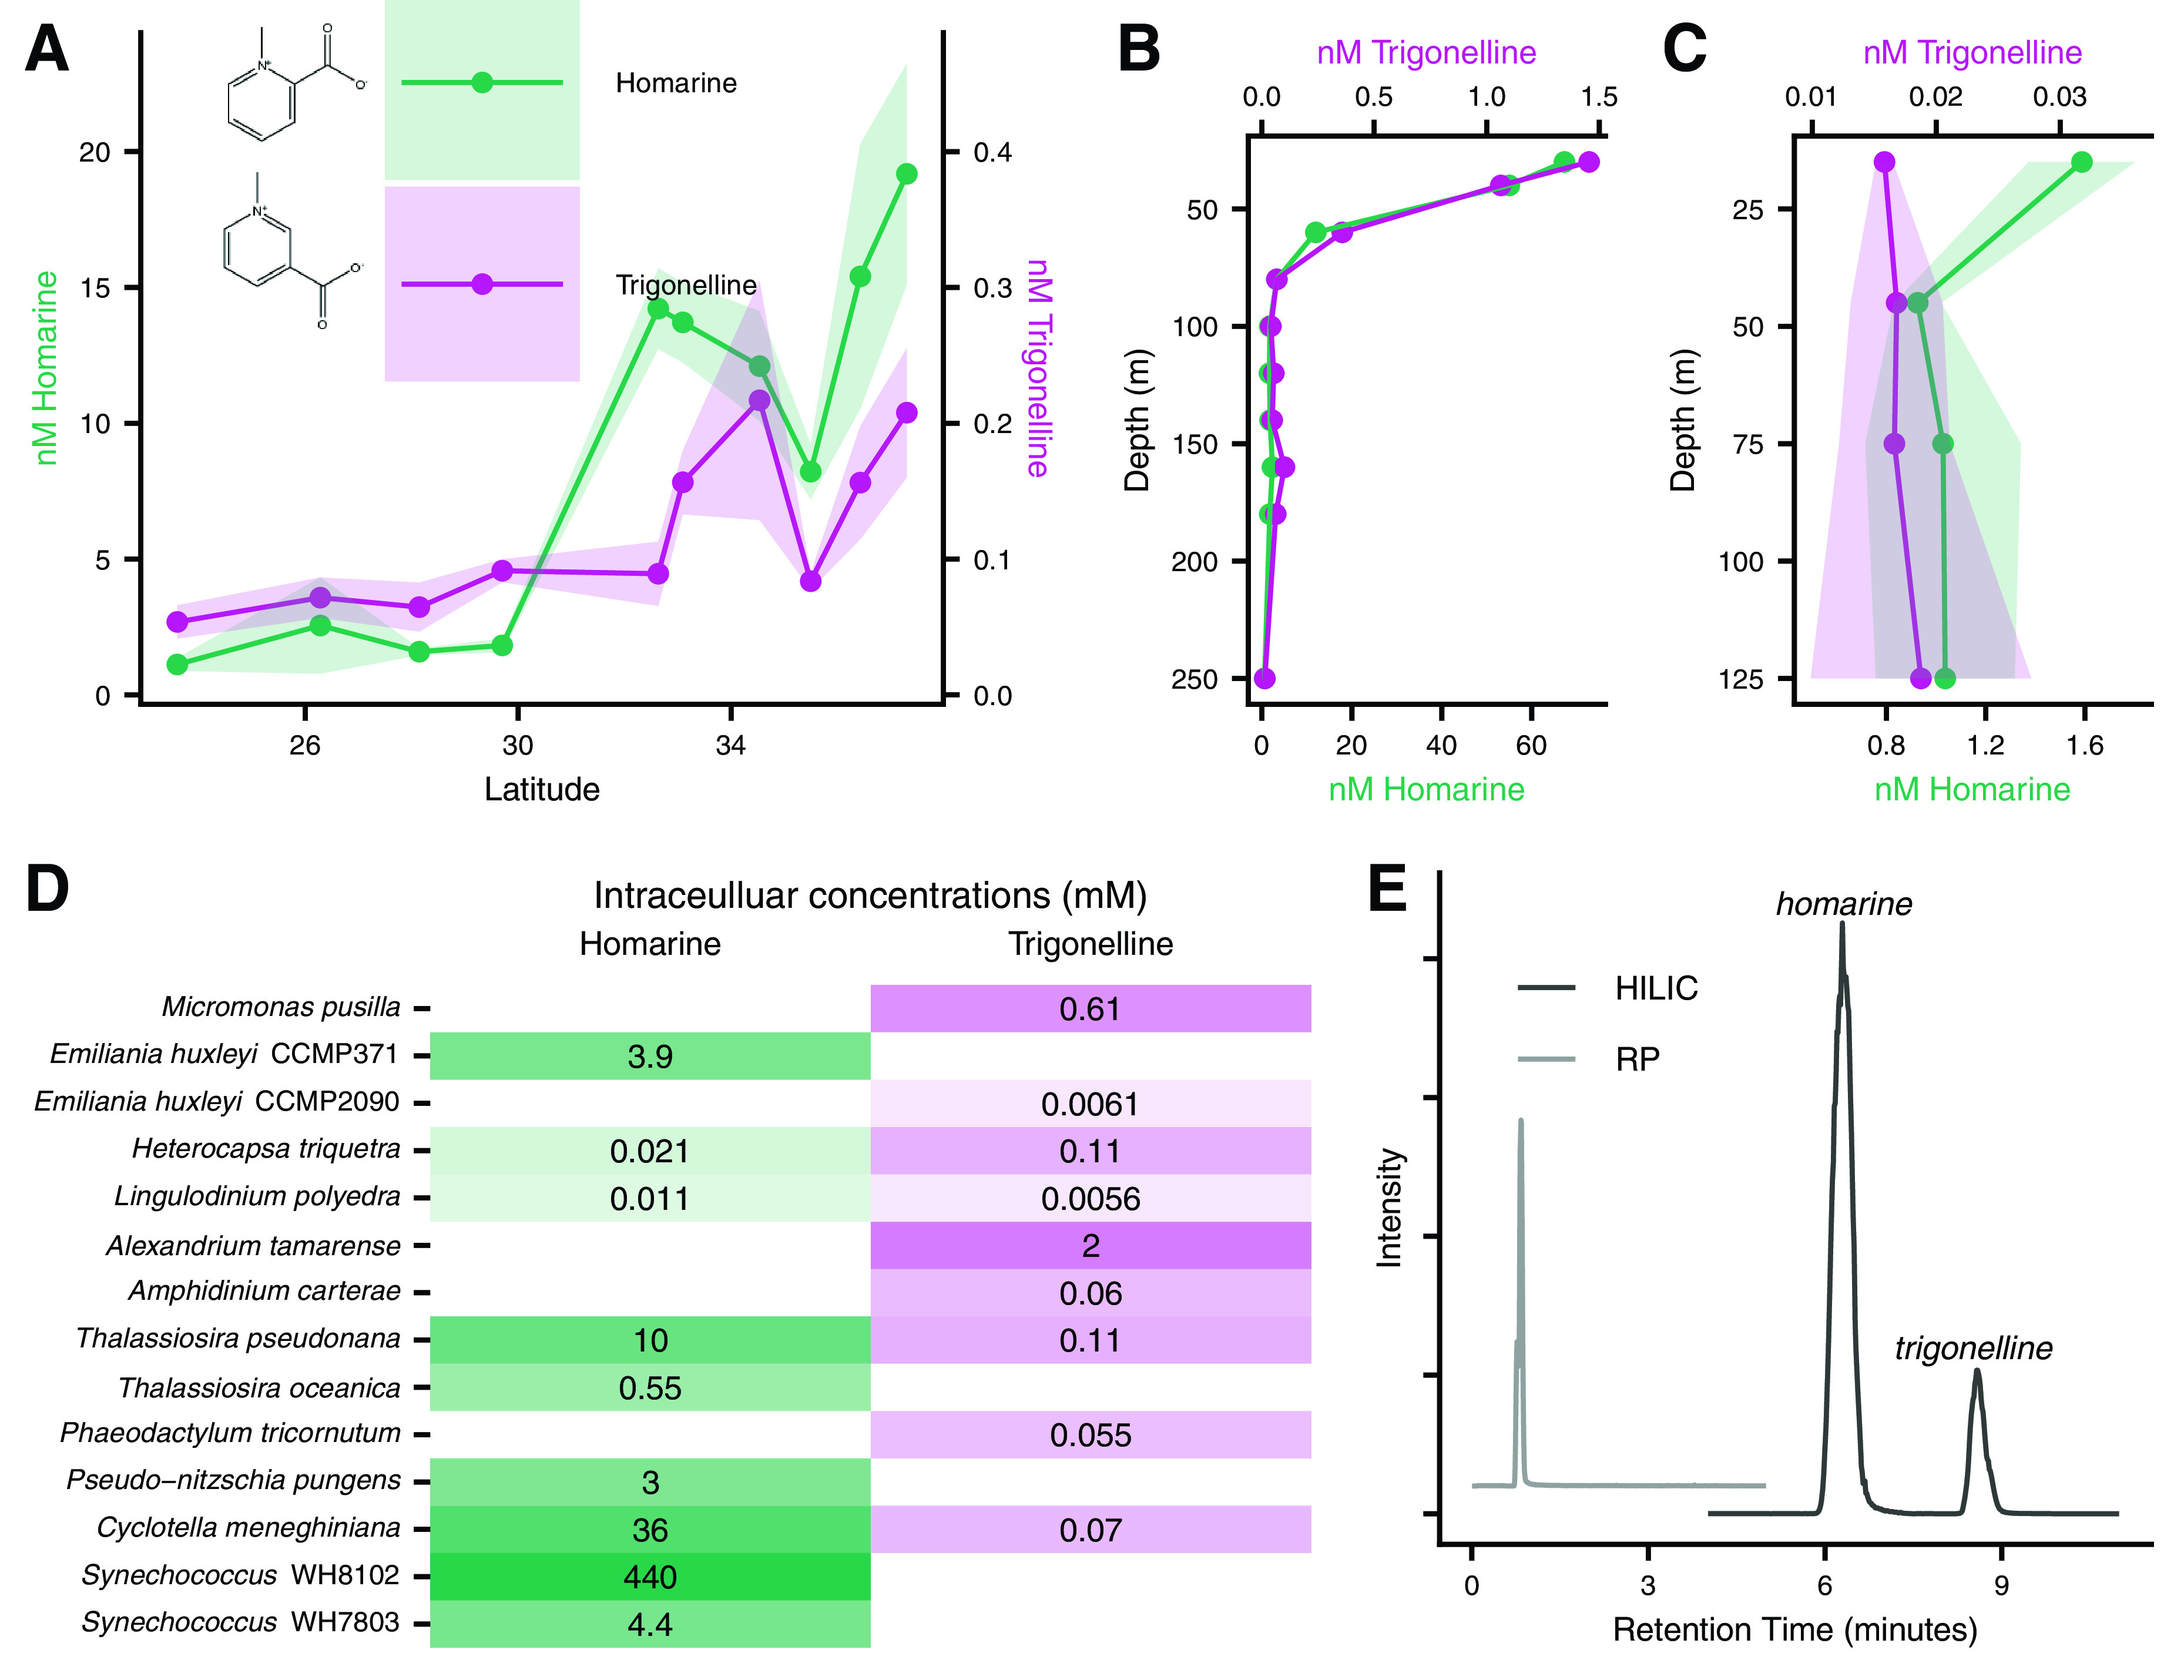
FIG 6.

(A to C) Homarine and trigonelline spatial patterns in meridional transect (A), NPTZ depth profile (B), and NPSG depth profile (C). (D) Intracellular concentrations of homarine and trigonelline in relevant organisms. (E) Chromatograms show the separation under HILIC but not RP. Note the different scales for trigonelline and homarine (A to C) and depth (B and C).
