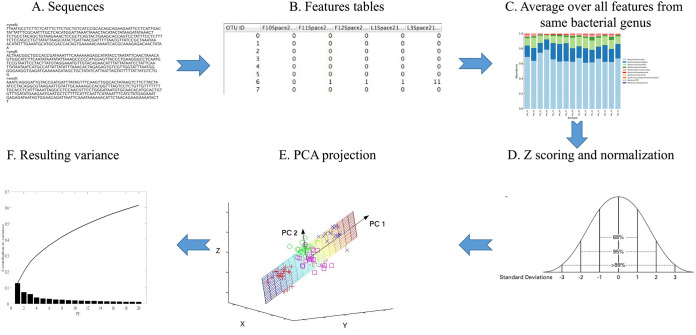
FIG 2.
Outline of analysis (from top left to top right and then from bottom right to bottom left). First, the Fastq sequences are quality controlled. The good quality sequences are translated to features using QIIME2. To homogenize the description level, the feature levels belonging to the same genus in a given sample are averaged to the genus level. (Bottom) The sample distribution is heavy-tailed. It is thus log transformed with a minimal value (0.1) added to each feature level to avoid log of zero values. The results are then z scored by removing the average and dividing by the standard deviation of each sample. The dimension of the z-scores is further reduced using PCA. The first eight PCs explain approximately 50% of the total variance (bottom left panel).

