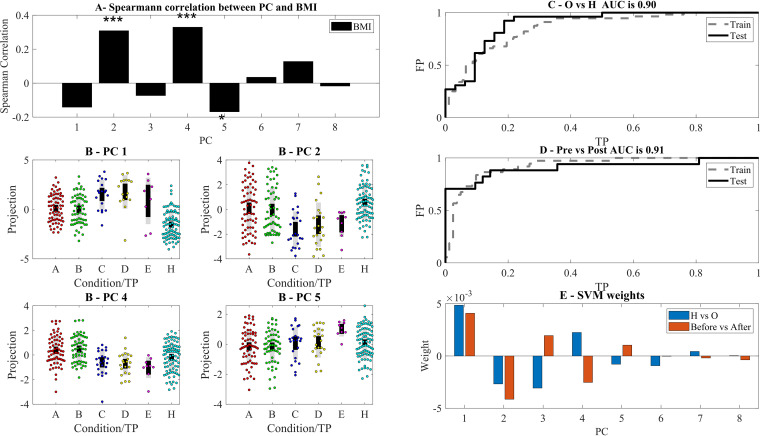
FIG 3.
(A) Spearman correlation between BMI of samples and the eight highest variance PCs. ***, **, and * represent significance levels of 0.001, 0.01, and 0.05, respectively (in this and all following figures). PC2, PC4, and PC5 are the most correlated with BMI. (B) Projection of the significant PCs on the different stages. One can see in all PCs a clear difference between the H and obese states. Following surgery, the projection is farther away from the H state than before. Note that we do not have microbiome samples from the latest time points. TP, time point. (C to E) Receiver operating characteristic (ROC) curve of linear SVM classification using the projections on the first 8 PCs of the H versus O and within the O group before versus after surgery (C and D) and the resulting weights (E).

