Figure 1.
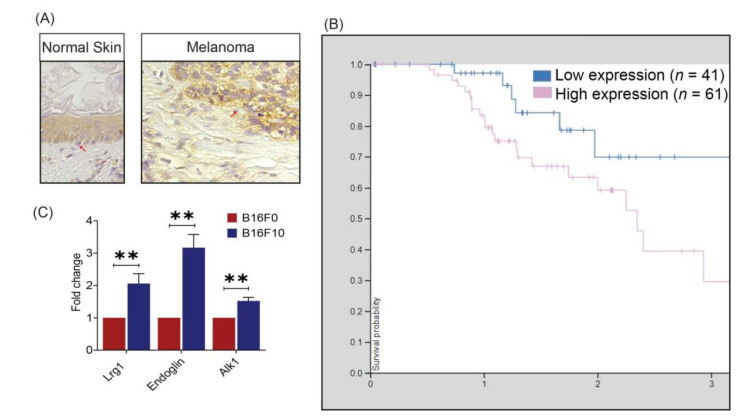
LRG1 expression in human melanoma biopsies and mouse melanoma cell lines. (A) Representative photomicrographs of immunohistochemistry staining demonstrating the expression pattern of LRG1 in normal human skin and malignant melanoma tissue. (B) Kaplan–Meier curves showing stratification of three-year survival probability as a function of LRG1 RNA expression (adapted from The Human Protein Atlas). (C) Real-time quantitative PCR analysis of Lrg1, endoglin, and Alk 1 expression. Data are presented as the mean ± S.E.M of three independent experiments. Statistical analysis was performed via two-tailed, unpaired Student’s t-test; ** p < 0.01.

