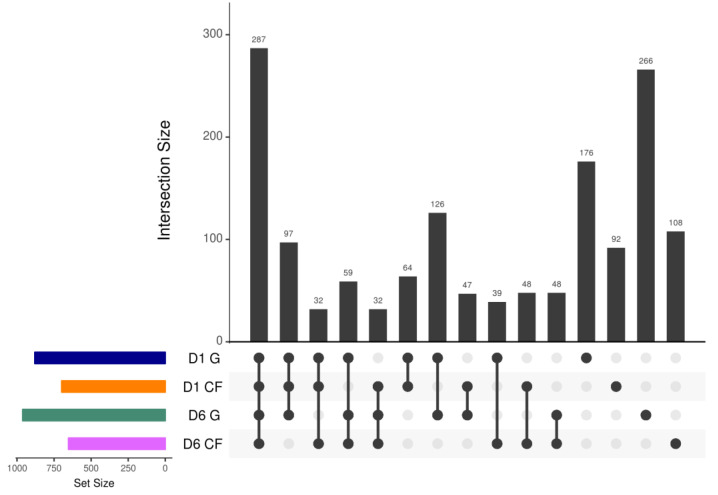
Figure 9.
UpSet plot of intersections between sets of bacterial genes induced (family-wise error rate <0.05, log 2-fold change >2) by chitosan-dressing treatment compared with gauze-dressing treatment. The bar chart on the left indicates the total number of upregulated bacterial genes for each dressing. The upper bar chart indicates the intersection size between sets of bacterial genes upregulated with one or more dressings. Dark connected dots in the bottom panel represent the substrates considered for each intersection (D1 = day 1; D6 = day 6; G = gauze; CF = chitosan).

