
Figure 4.
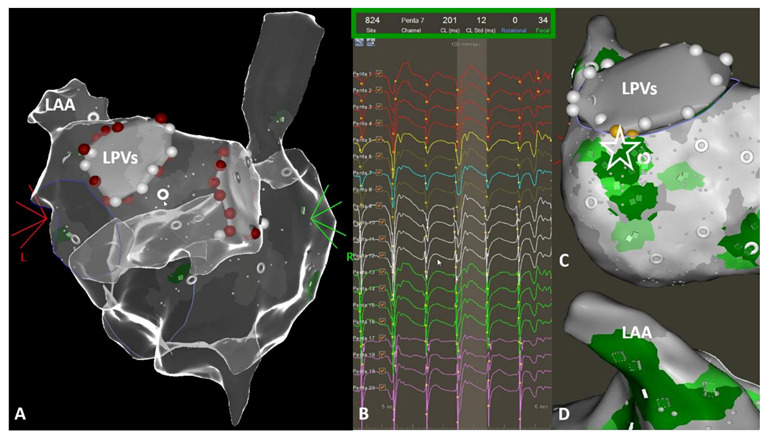
(A,C) Typical example for focal activities (green color) revealed from CARTOFINDER mapping of the right and left atrium and left atrial appendage. (D) The grey ring represents the center of a mapping position, using the PentaRay catheter. The light grey surface around the ring visualizes the coverage of the LA wall surface with the five PentaRay splines. (B) Focal activation is detected by identifying an S wave in the unipolar electrograms. If S wave patterns preceding activity on neighboring electrodes are detected during at least two consecutive atrial cycles, the site is designated as a focal source.