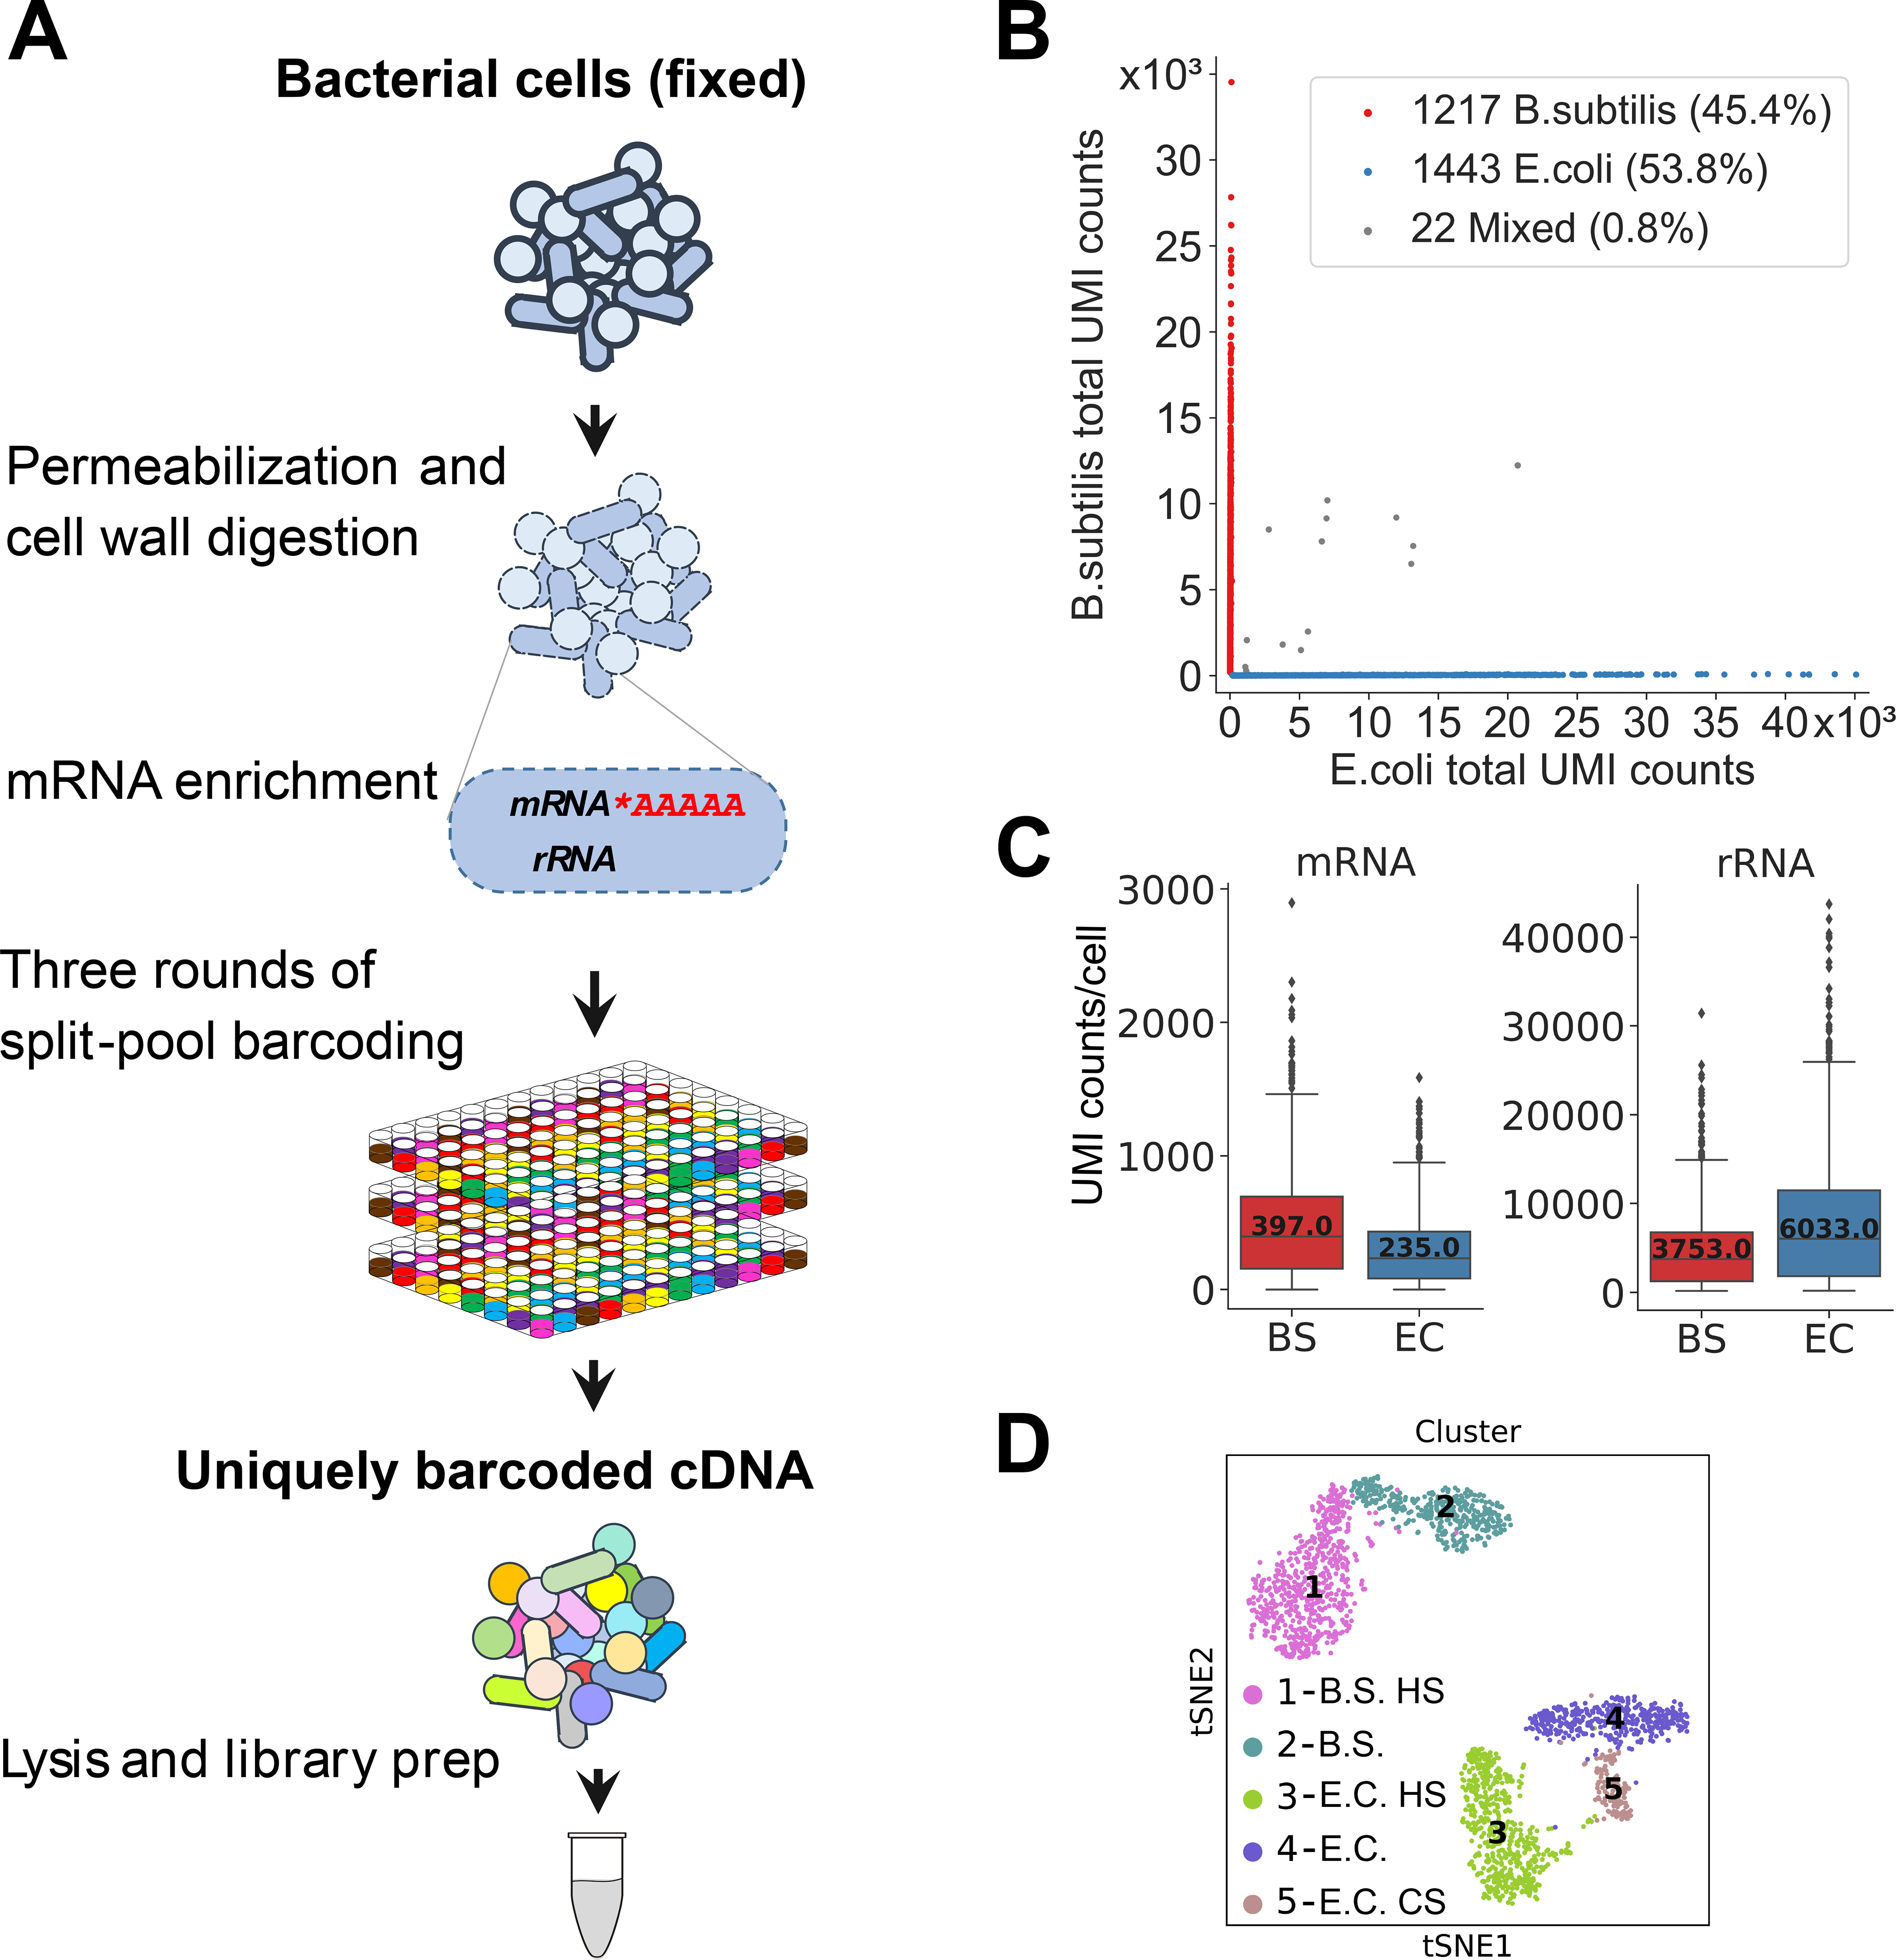
Fig. 1. MicroSPLiT development and validation.

(A) MicroSPLiT method summary. Fixed bacterial cells are permeabilized with Tween-20 and lysozyme. The mRNA is then polyadenylated in-cell with E. coli Poly(A) Polymerase I (PAP). The cellular RNA then undergoes three rounds of combinatorial barcoding including in-cell reverse transcription (RT) and two in-cell ligation reactions, followed by lysis and library preparation. (B) Barnyard plot for the E. coli and B. subtilis species-mixing experiment. Each dot corresponds to a putative single-cell transcriptome. Total UMI (unique molecular identifier) counts for all types of RNA are plotted. (C) mRNA and rRNA UMI counts per cell for both species. Error bars represent 95% confidence intervals. (D) t-stochastic neighbor embedding (t-SNE) of the data from heat shock experiment showing distinct clusters. “HS” – heat shock, “CS” – cold shock (see (20)).
