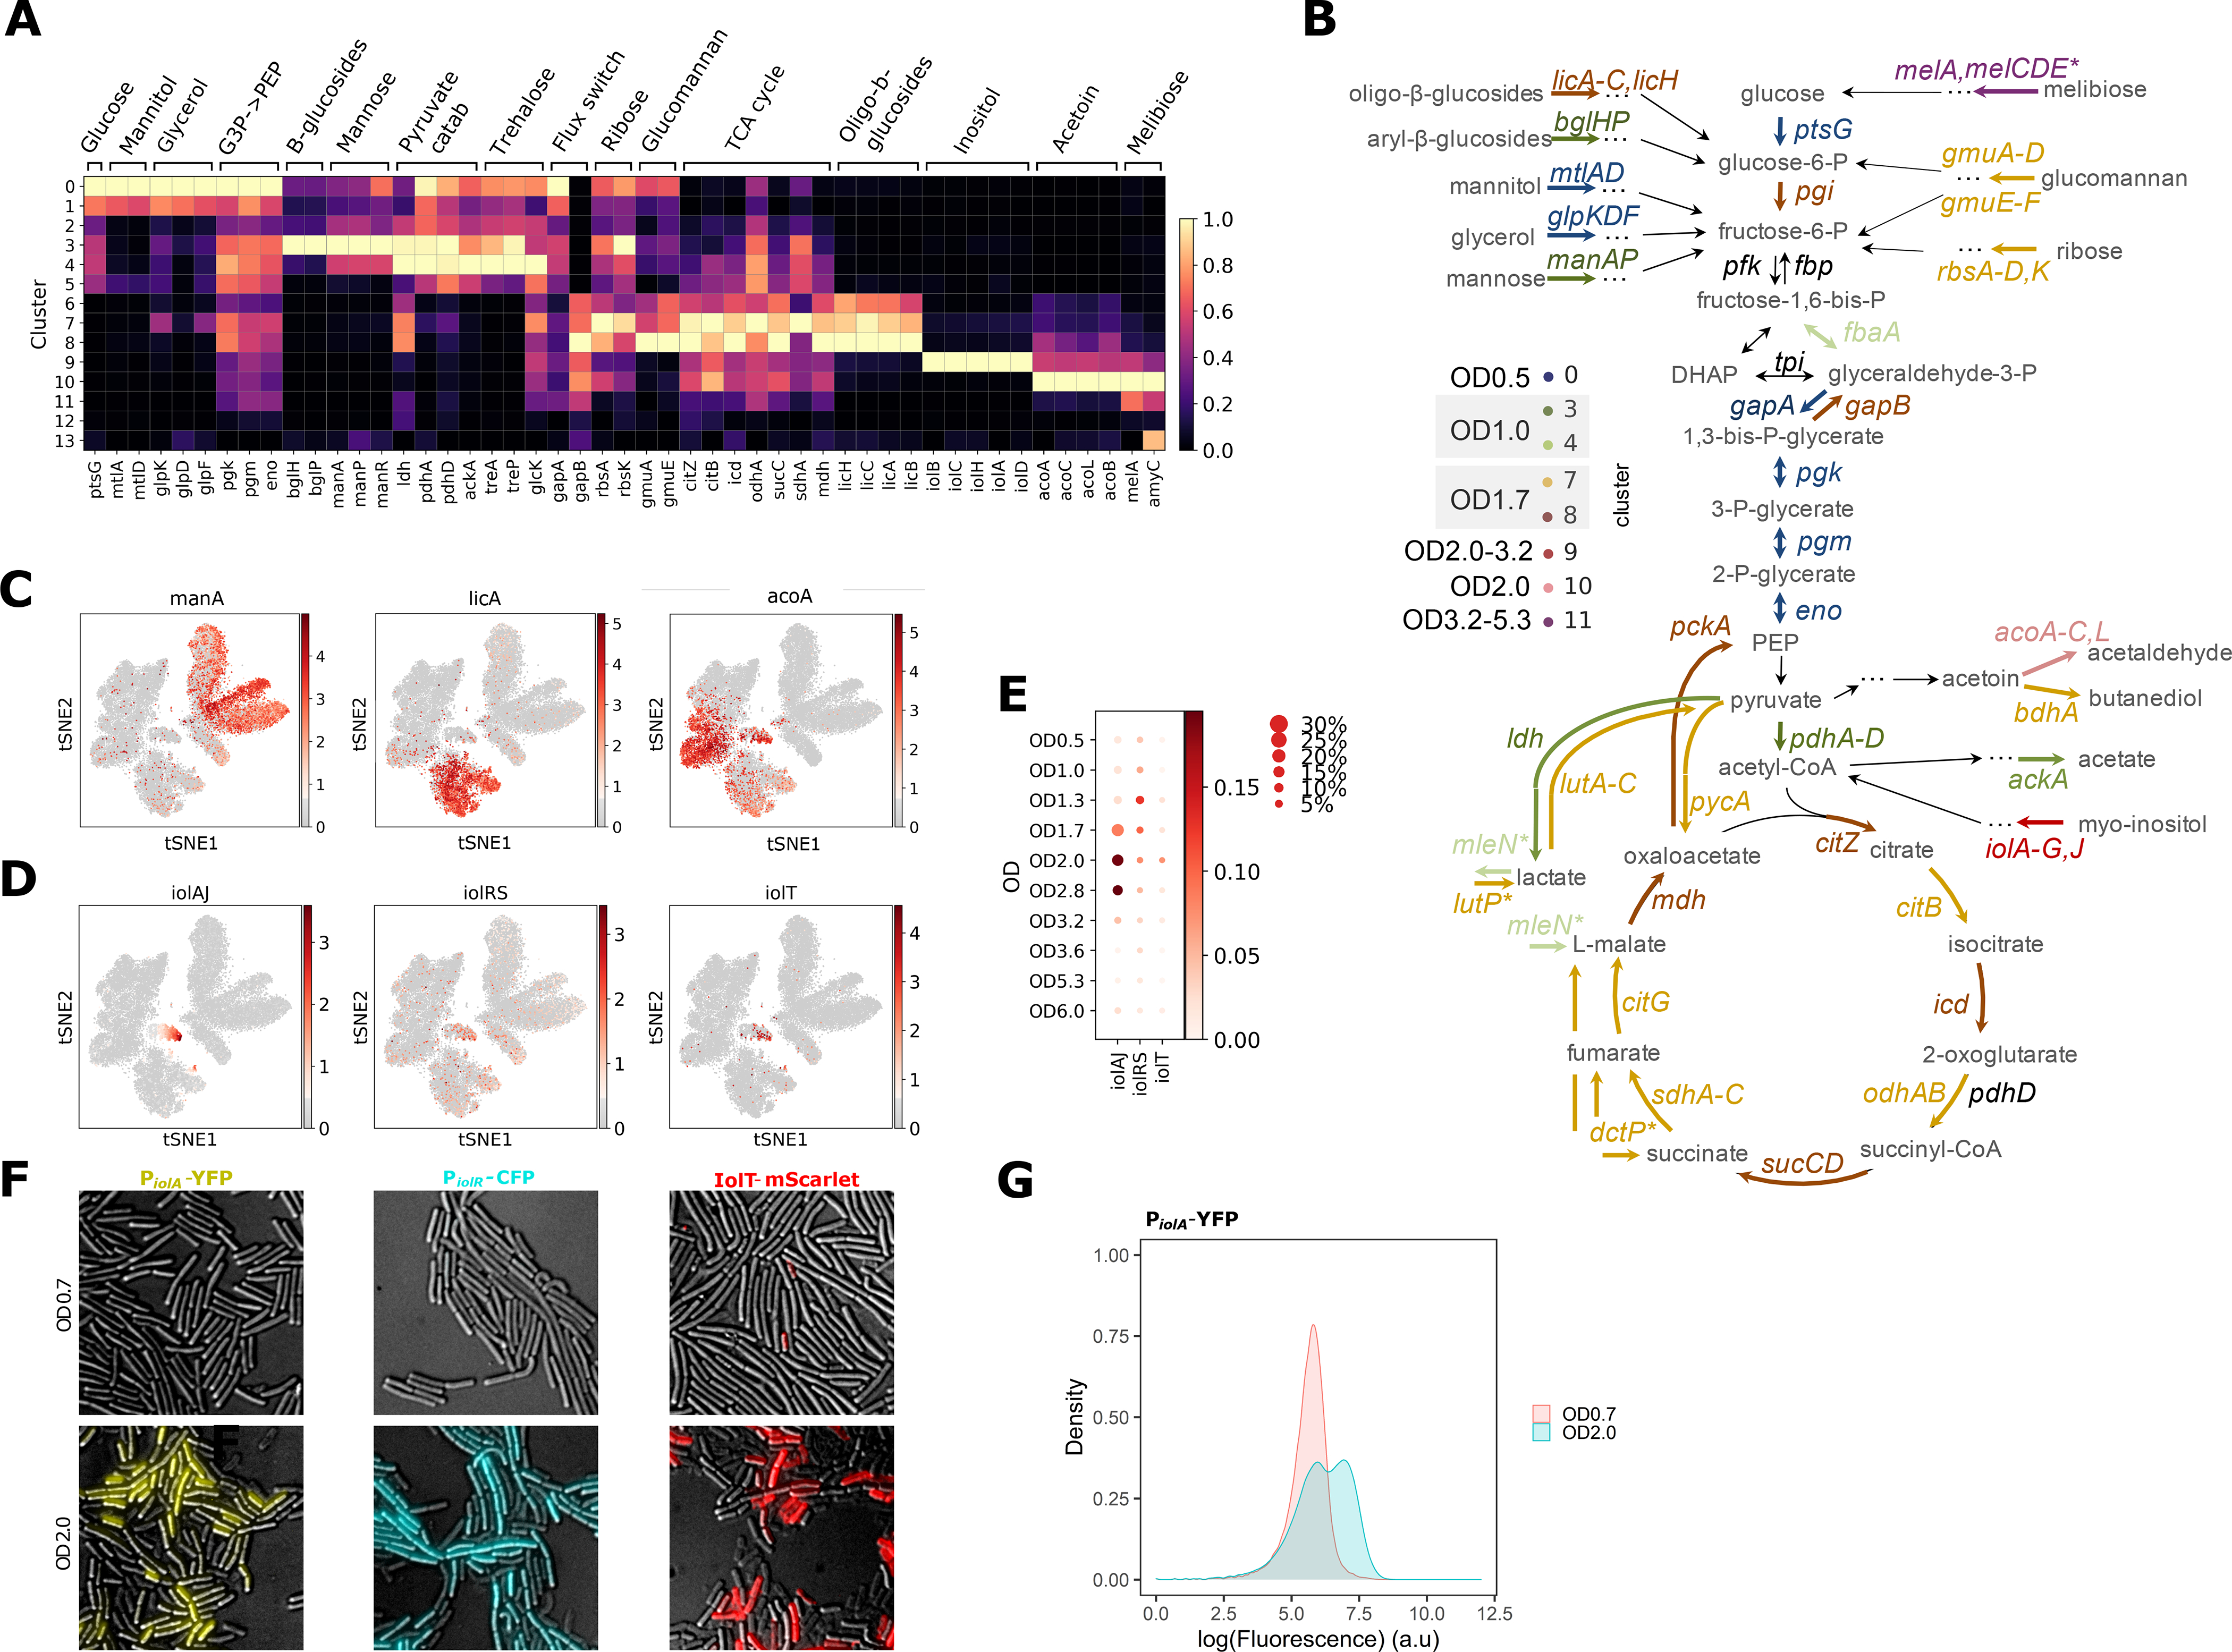
Fig. 3. Central carbon metabolism changes and alternative carbon sources utilization during B. subtilis growth.

(A) Normalized expression of genes from select metabolic pathways and central carbon metabolism shown per cluster. Gene expression shows distinct carbon utilization programs associated with different clusters and growth states. (B) Schematic of the central carbon metabolism pathway showing alternative carbon sources, metabolic products and genes in the pathway. The genes are color-coded according to the cluster they are highest expressed in. (C) Expression of select genes from (A) overlaid on the t-SNE plot to illustrate the differential patterns of activation. (D) Expression of each of the three inositol utilization operons, averaged across all genes in a given operon, and overlaid on the t-SNE plot. (E) Activities of the three inositol utilization operons across ODs. The size of each dot indicates the proportion of cells in each OD sample expressing any of the genes in the selected operon, while the color shows the average expression of the genes in a given operon. (F) Fluorescence and DIC microscopy overlays of B. subtilis expressing PiolA-YFP (left), PiolR-CFP (middle) or IolT-mScarlet-I (right) grown in LB to OD0.7 (top row) or OD2.0 (bottom row). (G) Flow cytometry of PiolA-YFP strain grown to OD0.7 or 2.0.
