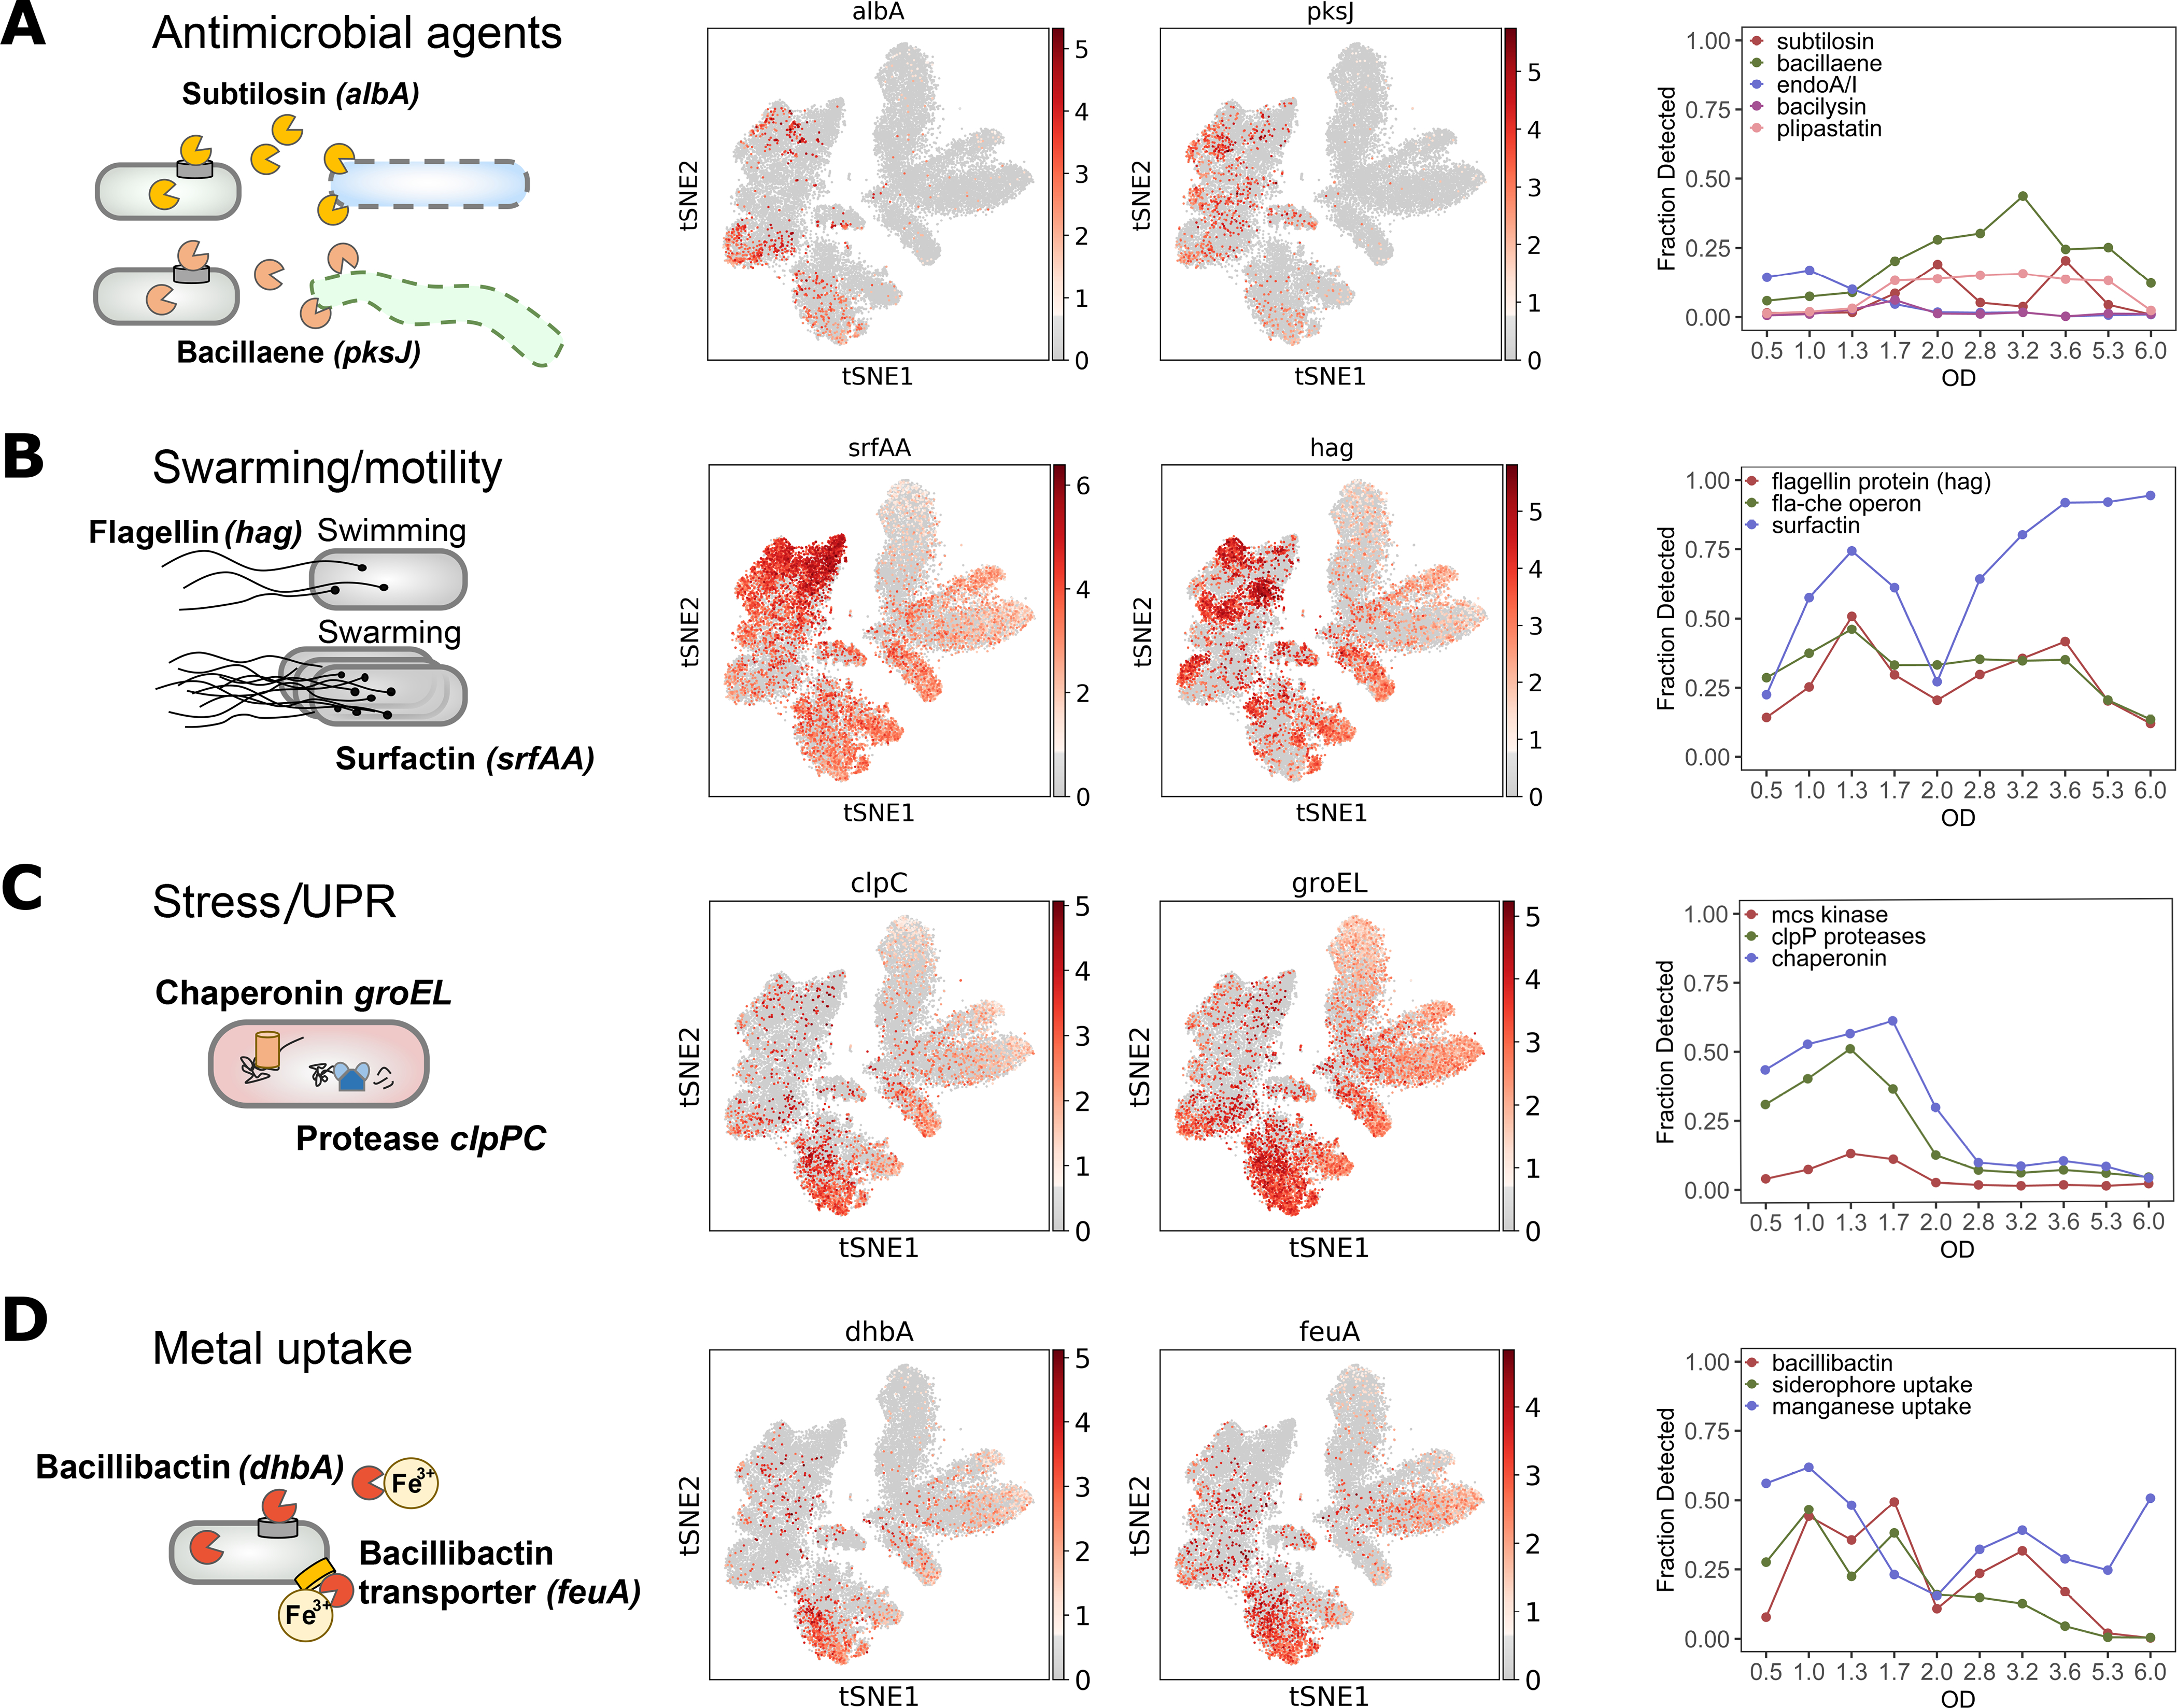
Fig. 4. Intrinsic stress responses and developmental gene expression.

Left to right: Pathway diagram. Overlays of expression of genes representative of each pathway on the t-SNE. Fraction of cells expressing at least one of the genes in the indicated operon as a function of OD. (A) Antimicrobial agents (subtilosin (albA) and bacillaene (pksJ)) and endoA toxin-antitoxin system. (B) Swarming and motility (surfactin (srfAA) and flagellin (hag)). (C) Intrinsic stress and unfolded protein response (UPR) (GroEL chaperonin (groEL) and ClpCP protease (clpC)). (D) Iron (bacillibactin (dhbA) and siderophore transporter (feuA)) and manganese uptake. The genes used for fractional plots are listed in Table S2.
