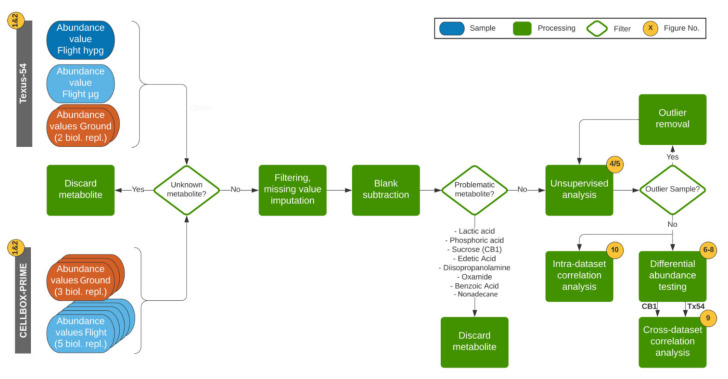
Figure 3.
Workflow schematics of the data analysis. Corresponding figures from this paper are indicated in yellow circles. Samples that were analyzed by Gas Chromatography - Mass Spectrometry (GC-MS) and were peak-called, standardized and-post processed per experiment, were analyzed as abundance values. Metabolite spectra that could not be matched with a well-characterized reference metabolite were therefore called unknown metabolites and were filtered out from the datasets. Consecutively, metabolites with a large number of missing values/non-present metabolites per dataset were excluded, and metabolites with a small number of missing values underwent missing value imputation. Biological media blanks were subtracted. Further, problematic metabolites that were impurities from the equipment, used for fixation or with no biological information yield, were discarded. An unsupervised analysis (Figure 4 and Figure 5), based on heatmaps and principal component analysis, was performed and potential outlier samples removed. Consecutively, metabolites that were significantly differentially abundant in different experimental groups were identified per experiment (Figure 6, Figure 7 and Figure 8). Metabolites that were present in both datasets were compared in terms of fold change and direction of regulation (Figure 9). Independently, intra-dataset metabolite abundance values were correlated against each other to be able to detect potential regulatory associations (Figure 10).

