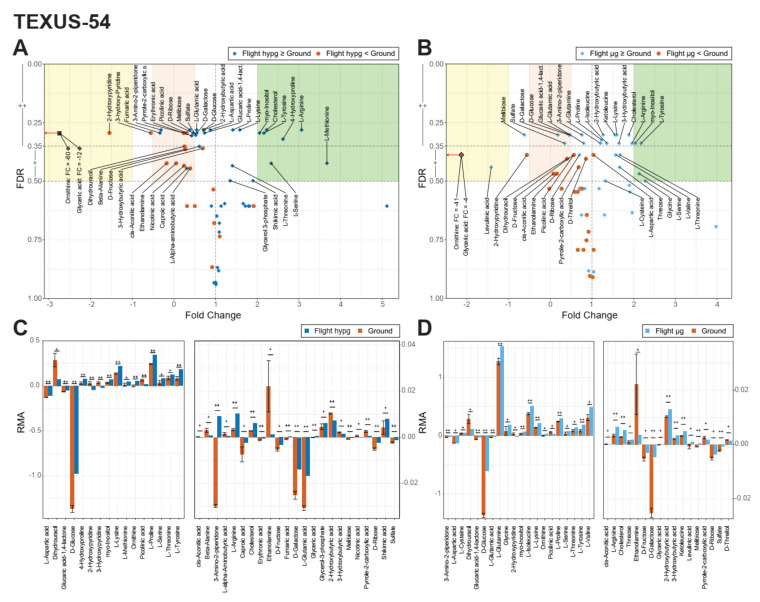
Figure 6.
Volcano and bar plots of samples from TEXUS-54. (A,B) Volcano plots showing the estimated false discovery rate (FDR) against fold change (FC) for the (A) comparisons flight hypg/ground and (B) flight µg/ground. Because some metabolites showed negative abundance values relative to medium blanks, FC can be negative. The direction of change is indicated by color and shape of the point. As an orientation aid, areas of significant large effect increase (double or more) are highlighted by a light green frame, areas of significant effect decrease (half or less, and inverted if below 0) are highlighted in red, and areas of significant effect inversion (consumption of metabolite to production or production to consumption) with equal or increased effect strength are highlighted in light yellow. (A) 41% of all metabolites showed an FDR below 0.35, 63% below 0.5. Ornithine, and glyceric acid showed exceptionally low FCs of −60, and −12, respectively, which exceed the plot margins and are therefore set to smaller values with the correct fold change indicated in their labels. (B) 29% of all metabolites showed an FDR below 0.35, 60% below 0.5. Also, Ornithine and Glyceric acid showed exceptionally low FCs of −41, and −4, respectively. (C,D): Bar plots showing relative metabolite abundance (RMA) for flight hypg (C) and flight µg (D) and the ground samples for metabolites with an FDR ≤ 0.5. Ground samples are pooled from two biological samples. Error bars represent mean ± standard deviation. +: FDR ≤ 0.5; ++: FDR ≤ 0.35. The plots are split into two subplots with two different linear axes to be able to display all metabolites on linear scales despite their RMA distribution over several orders of magnitude.

