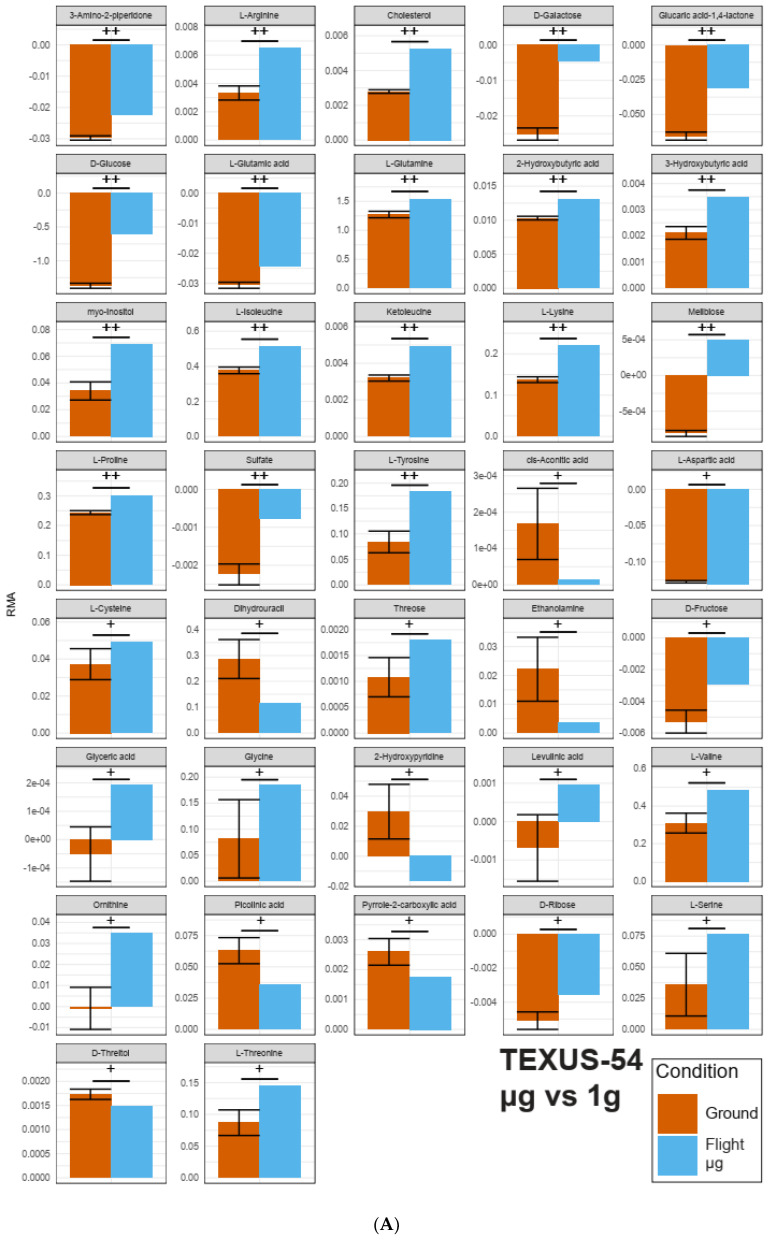
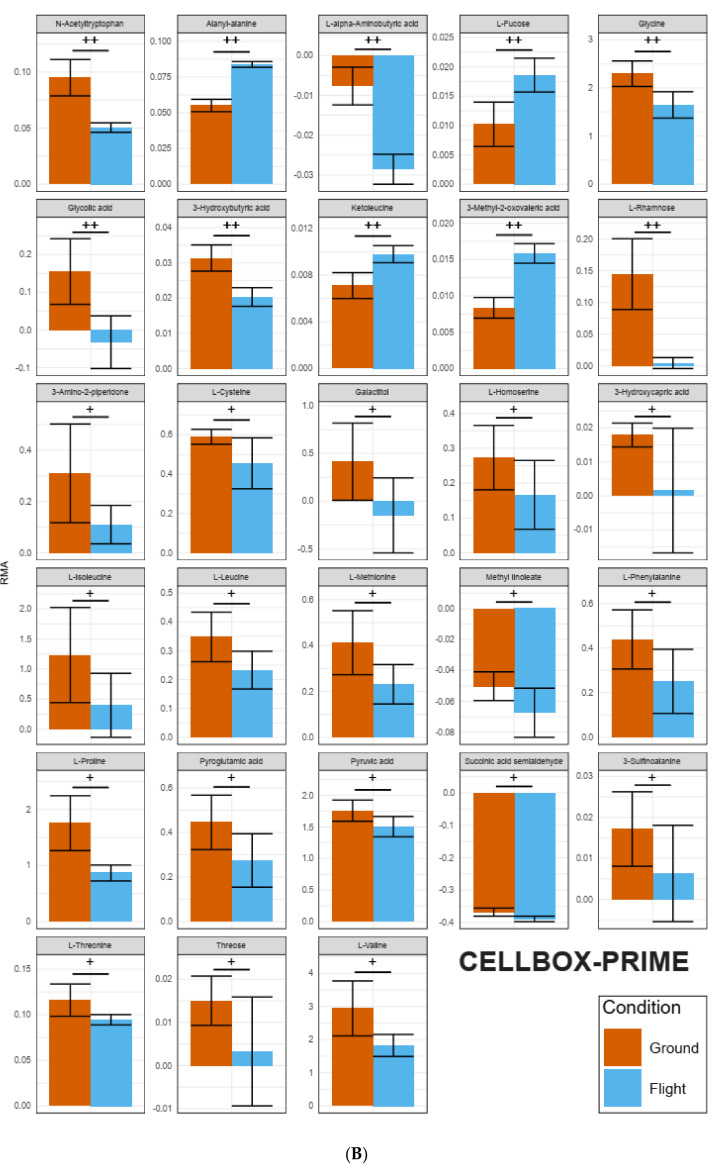
Figure 8.
(A). Faceted bar plots for TEXUS-54 µg vs. ground control. Only metabolites with FDR ≤ 0.5 are shown. Each metabolite is shown with an individual relative metabolite abundance (RMA) scale. Ground samples are pooled from two biological samples, mean ± standard deviation is shown. +: FDR ≤ 0.5; ++: FDR ≤ 0.35. (B). Faceted bar plots for CELLBOX-PRIME. Only metabolites with FDR ≤ 0.5 are shown. Each metabolite is shown with an individual relative metabolite abundance (RMA) scale. Samples are pooled from three (ground) and four (flight) samples, respectively. Mean ± standard deviation is shown. +: FDR ≤ 0.5; ++: FDR ≤ 0.35.


