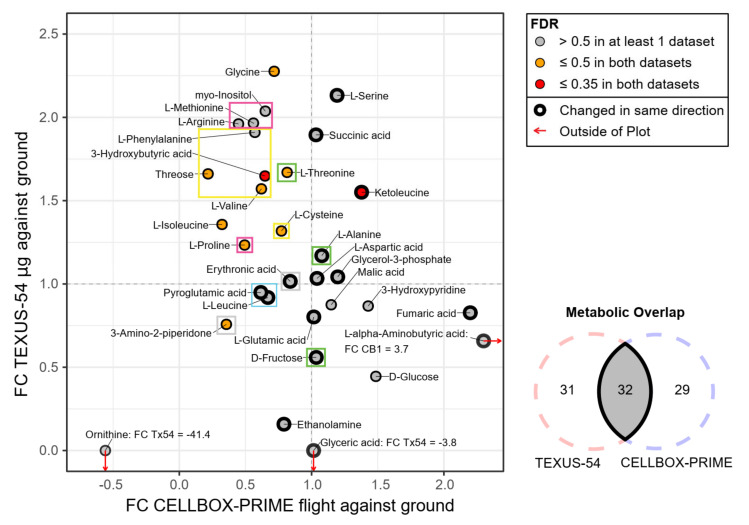
Figure 10.
Inter-experiment correlation diagram, plotting the fold changes of shared metabolites. Each dot represents 1 out of 32 shared metabolites. Metabolites that show a difference in the same direction (decrease or increase of RMA value for both sets) are highlighted by a stronger black border. Metabolites that have FDRs lower than certain thresholds are highlighted in yellow or red (comp. legend). Ornithine, Glyceric acid, and L-alpha-Aminobutyric acid all have fold changes that exceed the plot margins; they were set to a fold change of 0 for TEXUS-54, resp. 2.3 for L-alpha-Aminobutyric acid for CELLBOX-PRIME, the correct fold change was included in their label. Clusters that were identified in Figure 9 have been included in the figure by drawing colored boxes around metabolites that are in a cluster group. The plot has four different quadrants, with many metabolites in the top left quadrant with increased concentrations for TEXUS-54 and decreased concentrations for CELLBOX-PRIME, and a center that includes metabolites which do not or only slightly react to altered gravity.

