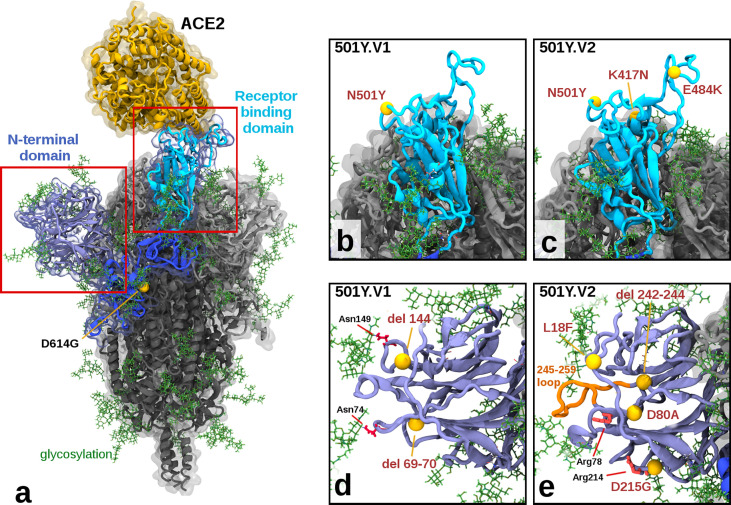
Figure 2.
Illustration of Mutations in 501Y.V1 and 501Y.V2 Relative to the Ancestral Form. (A) Structure of the glycosylated SARS CoV2 Spike protein highlighting a S1 monomer (in blues) and relative positions of the N terminal domain (NTD) and the receptor-binding domain (RBD) and the bound ACE2 receptor (in yellow). The position of D614G (common to all tested variants) is also highlighted. (B, C) Side by side comparison of 501Y.V1 and 501Y.V2 variants in the RBD, showing the V2 variant having additional K417N and E484K mutations. (D, E) Side by side comparisons of 501Y.V1 and 501Y.V2 variants in the NTD, showing relative locations of mutations and deletions. (Model files available in Supplementary Material ).

