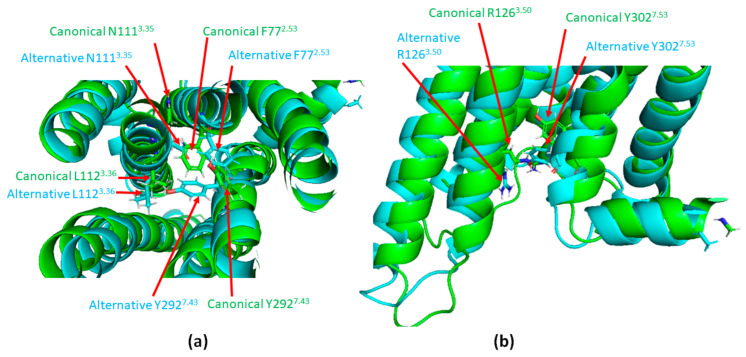
Figure 5.
Illustration of the long range allosteric network of AT1 inducing its switch to canonical active conformation. (a): Top view of the canonical (green) and alternative (cyan) active conformations of AT1. (b): Superimposition of the intracellular part of AT1 in its canonical (green) and alternative (cyan) active conformations. Canonical active and alternative active structures are simulation data available in supplementary material from [98]. The figure was prepared with the PyMOL software (The PyMOL Molecular Graphics System, Version 2.5.0. Schrödinger, LLC).

