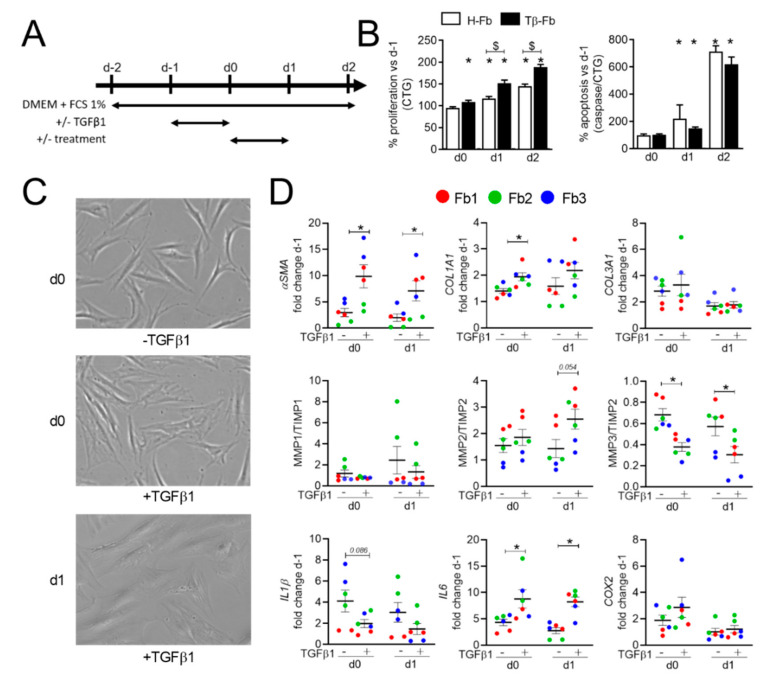
Figure 1.
In vitro model of Transforming Growth Factor β1 (TGFβ1)-stimulated fibroblasts. (A) Experimental scheme. Dermal fibroblasts from healthy donors (H-Fb) were starved in a DMEM medium containing 1% FCS (day-2) for 24 h before stimulation with TGFβ1 for 24 h. On day 0, treatment was applied for 24 h and samples were analyzed (day 1 or 2). (B) The proliferation of H-Fb or TGFβ1-stimulated fibroblasts (Tβ-Fb; left panel) normalized on day-1 (n = 12). Apoptosis normalized on CTG assay (right panel). (C) Representative pictures of H-Fb (−TGFβ1) on day 0 or Tβ-Fb (+TGFβ1) on days 0 and 1 after stimulation (×40 objective). (D) Fold change of gene expression normalized on day-1 (n = 6). *: p < 0.05 versus H-Fb on day 0 or $: p < 0.05 versus the indicated group.

