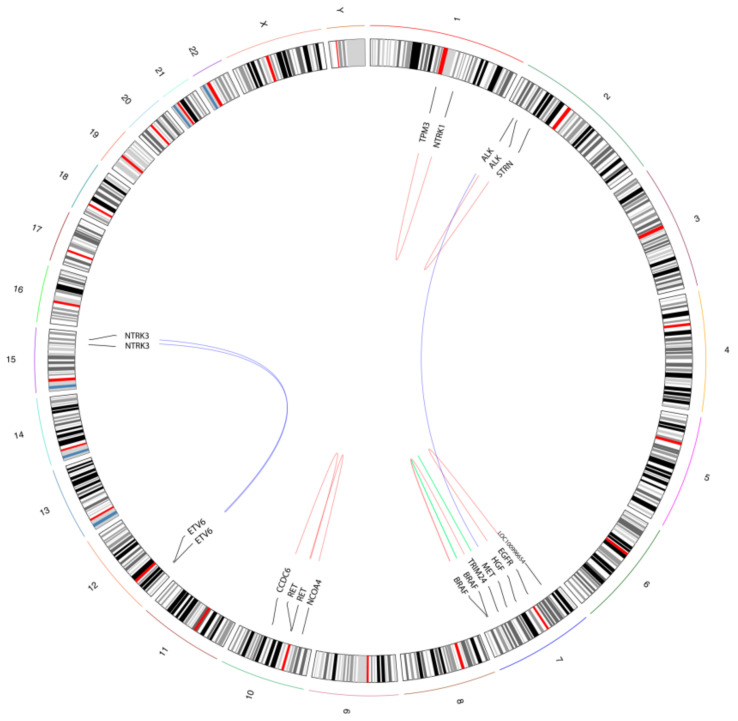
Figure 2.
Schematic illustration of the detected gene fusions and rearrangements. The circos plot summarizes the fusion events identified in the “real-world” cohort. The curved lines show partner genes, with blue lines representing inter-chromosomal fusions, red lines indicating intra-chromosomal fusion between different genes, and green lines representing intra-chromosomal rearrangements within the same gene.

