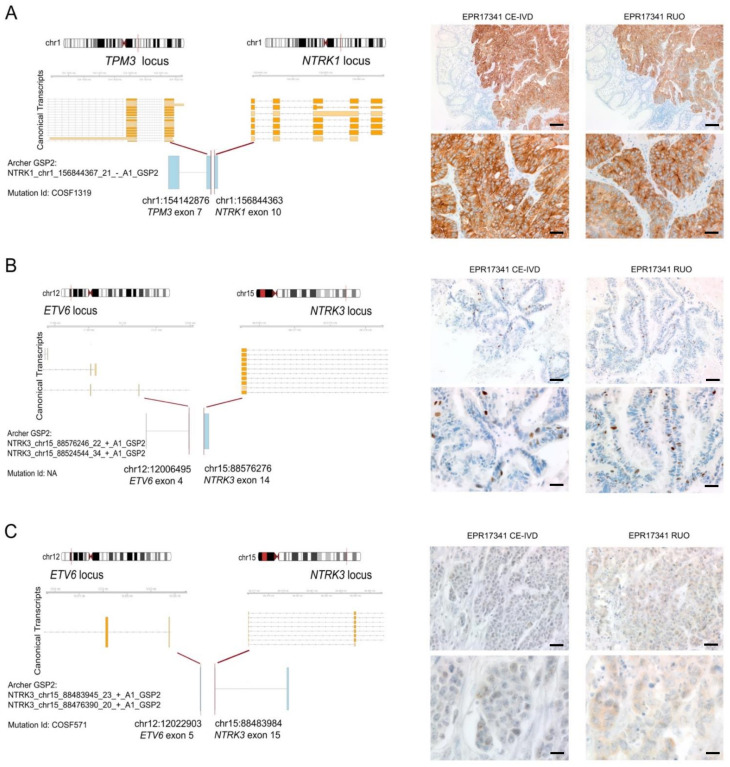
Figure 4.
Summary of the detected fusion events involving NTRK genes. Each panel consists of a schematic three-tier representation of the fusion identified by the NGS assay and the two pan-TRK antibody IHC stainings. The fusion point is identified by a red bar at the chromosomal loci. Below the chromosomal ideograms, the canonical transcripts reported by Ensembl (release 103) illustrate the transcriptional context of the involved genes (exons are indicated by orange boxes and introns are indicated by grey arrow-headed lines). Each row is a different isoform of the transcript reported by Ensembl. At the bottom, the fusion points between the Archer sequenced exons (blue boxes) and the exact chromosomal position of the breakpoint are reported. (A) Representation of the fusion between TPM3 and NTRK1 genes. The illustration reports the rearrangement breakpoint, the Archer panel technical output confirming the fusion, and the COSMIC ID. Representative micrographs of the CRC sample harbouring the fusion show a diffuse cytoplasmic expression with focal membranous linear patterns in the experiments run with both CE-IVD and RUO assays (scale bars: top panels, 100 μm; bottom panels, 50 μm). (B) Representation of the fusion between the ETV6 ex4 and NTRK3 ex14 genes. The illustration reports the rearrangement breakpoint, the Archer panel technical output confirming the fusion, and the COSMIC ID. IHC images highlight the presence of a subpopulation of tumour cells of the LAC with papillary features displaying an intense nuclear expression, as demonstrated by both assays (scale bars: top panels, 100 μm; bottom panels, 50 μm). (C) Representation of the fusion between ETV6 ex5 and NTRK3 ex15 genes. The illustration reports the rearrangement breakpoint, the Archer panel technical output confirming the fusion, and the COSMIC ID. A weak cytoplasmic expression is present in this CRC in both experiments, with the RUO assay showing a slightly more granular staining (scale bars: top panels, 50 μm; bottom panels, 25 μm).

