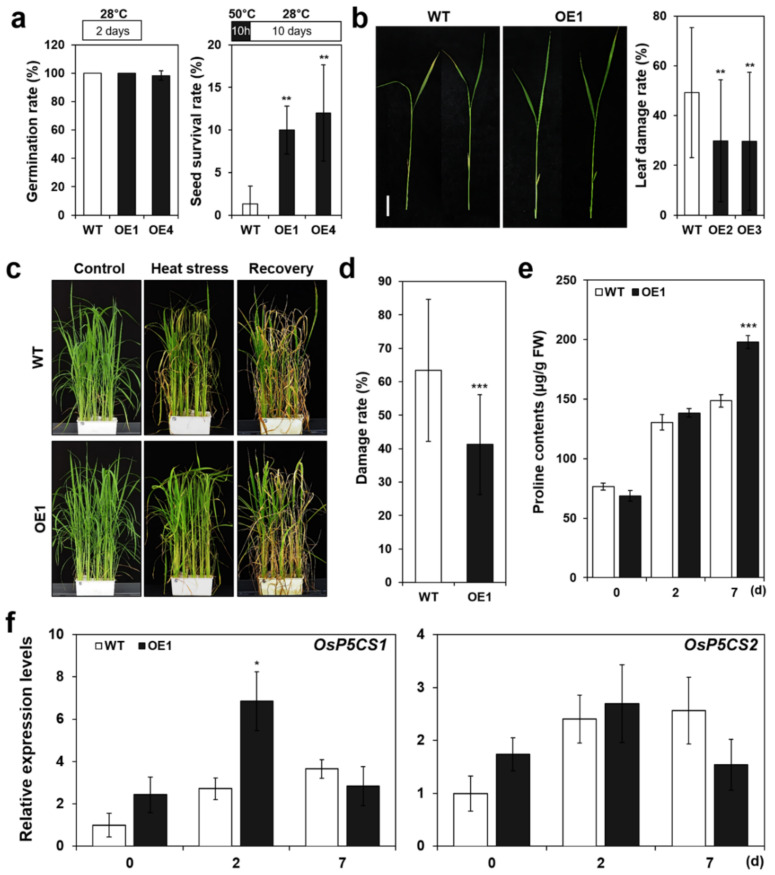
Figure 3.
OsERF115/AP2EREBP110-OE transgenic rice shows enhanced thermotolerance in mature seeds and vegetative stage plants. (a) Seed survival rate of WT and OsERF115/AP2EREBP110-OE lines after exposure to heat shock (50 °C). Surface-sterilized and imbibed husked seeds were placed on 1/2 MS medium and incubated for 10 h at 50 °C. After 10-days recovery at 28 °C, number of green seedlings germinated from the seeds were counted. Data represent mean (± SD) from three independent experiments with two biological replicates (n = 25). (b) Phenotypes of OsERF115/AP2EREBP110-OE and WT seedlings exposed to heat stress (37 °C) for 7 days at V2 growth stage. Scale bar: 4 cm. Photographs were taken at 7-days after heat treatment and leaf damage rate of each plant was scored. Data represent the mean (± SD) from three independent experiments with two biological replicates (n = 25). One-way ANOVA and Tukey’s HSD test were performed with a comparison of WT plants as controls (**, p < 0.01; ***, p < 0.001). (c–d) Phenotypes of WT and OsERF115/AP2EREBP110-OE plants exposed to heat stress (42 °C) at V6 growth stage. Plants grown in a soil pot were exposed to heat stress (42 °C) for 7 days and then recovered at 28 °C for 7 days. Photographs were taken at 7-days after recovery (c) and damage rate of each plant was scored (d). Data represent the mean (± SD) three independent experiments with two biological replicates (n = 25). Student’s t-test was performed through comparison with rice seeds exposed to 30 °C as controls (***, p < 0.001). (e) Proline contents of WT and OsERF115/AP2EREBP110-OE plants after 2- and 7-days of exposure to heat stress (42 °C). Data represent mean (± SD) from three independent experiments with two biological replicates (n = 3). (f) Relative expression levels of proline synthesis-related genes (OsP5CS1 and OsP6CS2) in OE and WT plants exposed to 42 °C heat stress for 2 and 7 days. Data represent mean (± SD) from three independent experiments with three biological replicates (n = 3). Two-way ANOVA and Fisher’s LSD test were performed by comparing with WT plants as controls (*, p < 0.05; ***, p < 0.001).

