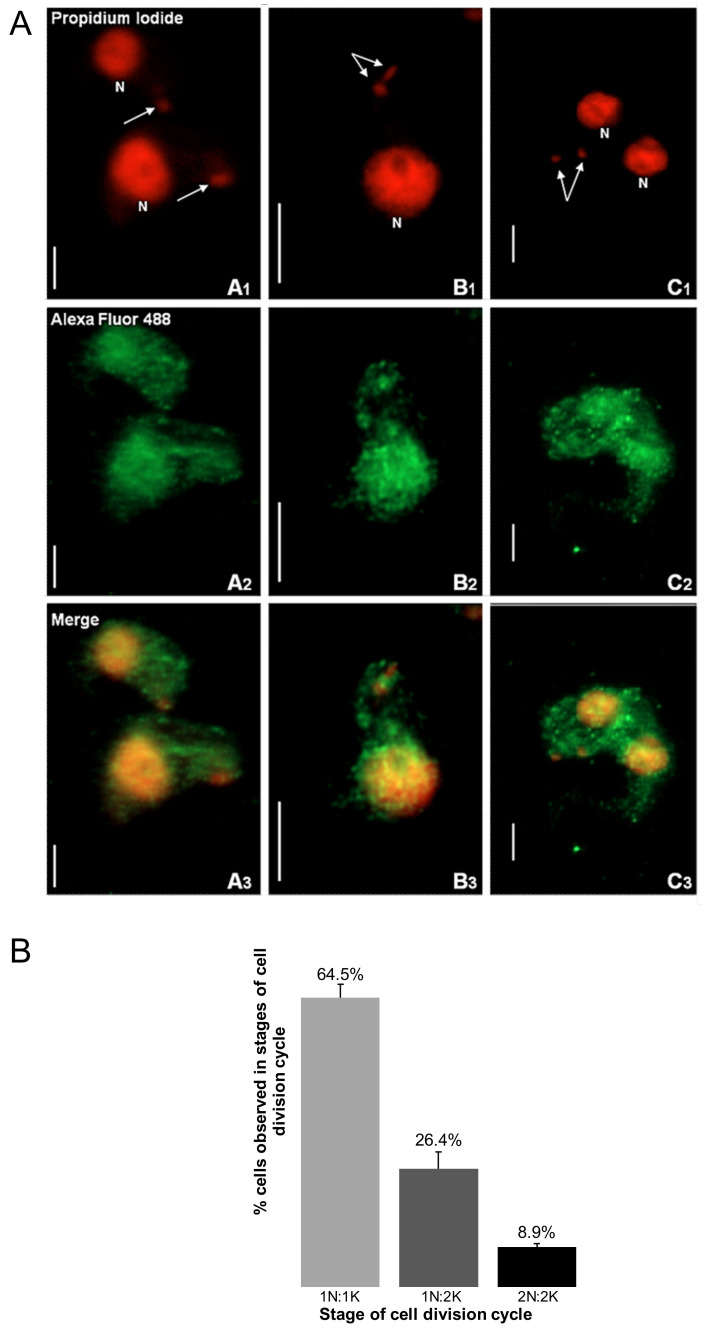
Figure 2.
The distribution of TbHsp70.c is cytosolic and nucleic along the T. brucei life cycle. (A) Morphology of the kinetoplast at different stages of the T. brucei bloodstream form cell cycle. The top row represents the propidium iodide signal in enlarged images of the number and location of nuclei (N) and kinetoplasts (arrow). Upright scale bar, 5 µm. Columns: A—cells have 1 nucleus and 1 kinetoplast (1N:1K); B—1N:2K; C—2N:2K. Rows: Propidium iodide—parasite DNA detected with a UV filter, shown in red; Alexa Fluor 488—localization of TbHsp70.c; Merge—amalgamated image of DNA staining and TbHsp70.c localization. (B) The percentage T. b. brucei cells counted containing 1N:1K, 1N:2K and 2N:2K. Error bars represent the standard deviation between two replicates.

