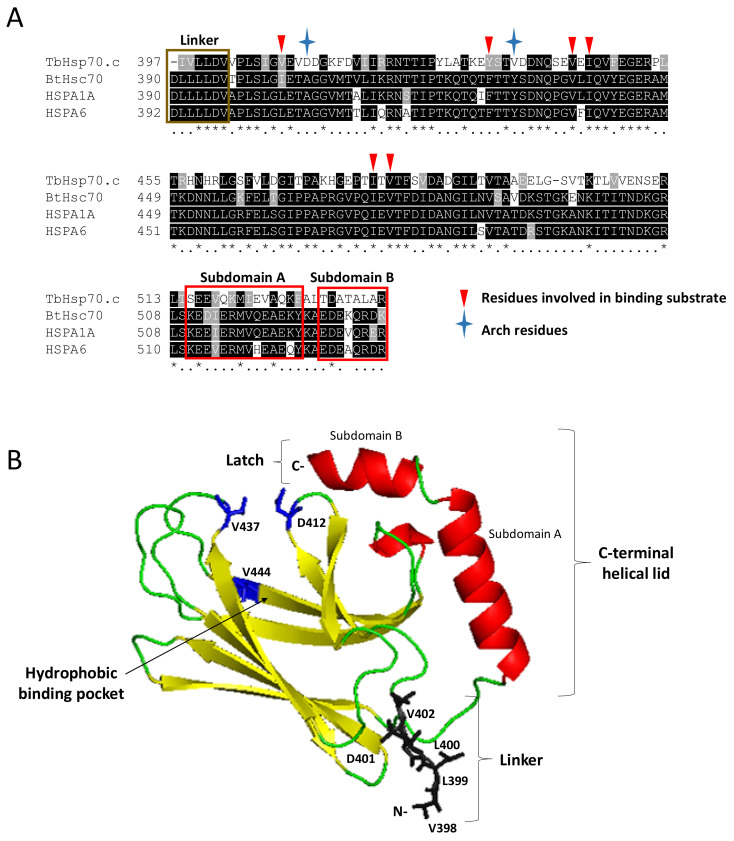
Figure 4.
Identification of key residues of TbHsp70.c and their predicted orientation in space. A multiple sequence alignment of the SBD of TbHsp70.c, bovine Hsc70, human HSPA1A and HSPA6 (A). Segments highlighted in yellow and red represent predicted secondary structures β-sheets and α-helices, respectively, and coincide with the modelled structure in panel B. Asterisk (*) symbols indicate positions that have fully conserved residues, and period (.) symbols indicate conservation between groups of weakly similar properties. Ribbon representation of the homology model of TbHsp70.c (B). The predicted homology model of TbHsp70.c (residues 397–540) highlights the linker region in brown; the predicted secondary structure β-sheets in yellow; predicted α-helices in red; arch and one pocket residue in blue. The root mean square deviation (RMSD) was calculated to be 0.257Å. PyMol was used to visualize the model [29].

