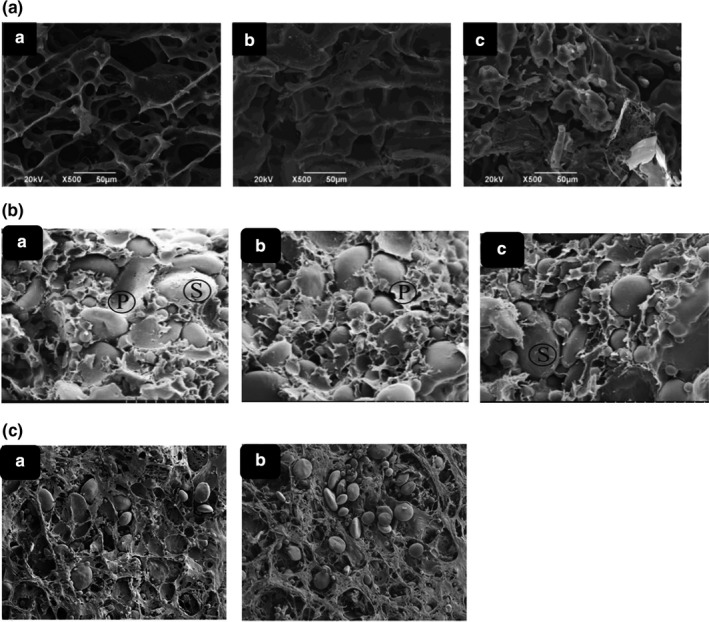
FIGURE 4.

Scanning electron microscopy (SEM) of wheat gluten samples (A) WG (a), WG treated with desired quantity of Alcalase (0.04%, HWG‐4; b) and (0.10%, w/w, HWG‐10; c) (Wang et al., 2016). SEM of gluten (B) without enzymes (a), xylanase (b), and cellulase (c) (Wang et al., 2018). SEM images of dough treated with pentosanase (C), dough without pentosanase (a), and dough treated with pentosanase (b) (Steffolani et al., 2010) (Sun et al., 2019)
