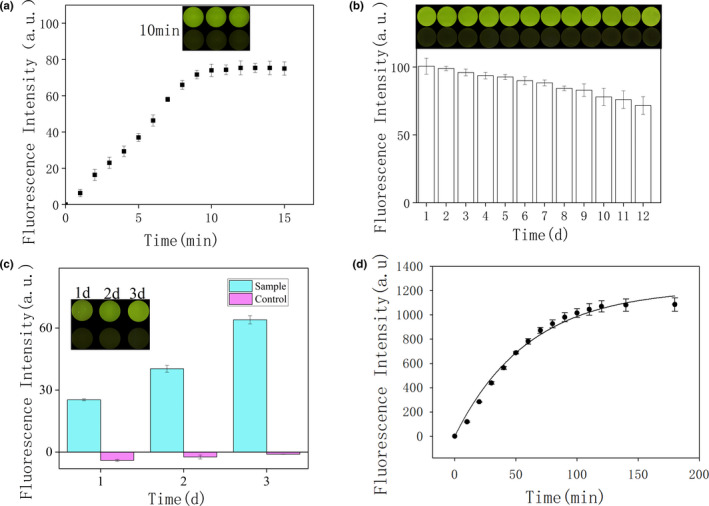
FIGURE 5.

(a) Kinetics of the indicator plate sensor over 15 min. Inset: image of the indicator board sensor after 10 min. (b) Fluorescence intensity of the indicator board sensor after 12 days. Inset: corresponding indicator board sensor image. (c) Comparison of DNAzyme cleavage activity between control and sample. Inset: Image of the indicator board sensor after 10 min after 3 days. (d) The fluorescence intensity of PAE‐1 DNAzym in 3 hr. The result of the fitted curve indicates the cleavage rate of PAE‐1 DNAzyme
