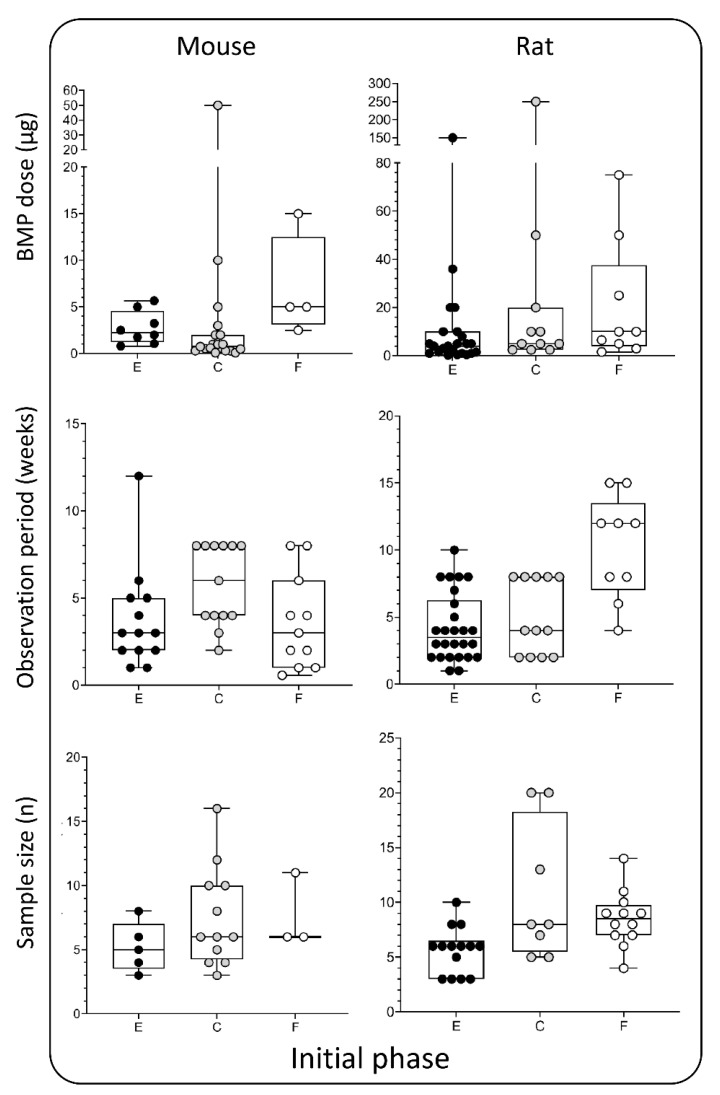
Figure 4.
BMP doses (µg), observation period (weeks), and sample size (n) used in the initial phase —rodent models. Data is presented through box and whisker plots in which dots represent all individual values from studies listed in Table 1 and Table 2. E—ectopic model, C—calvarial, and F—femoral defect.

