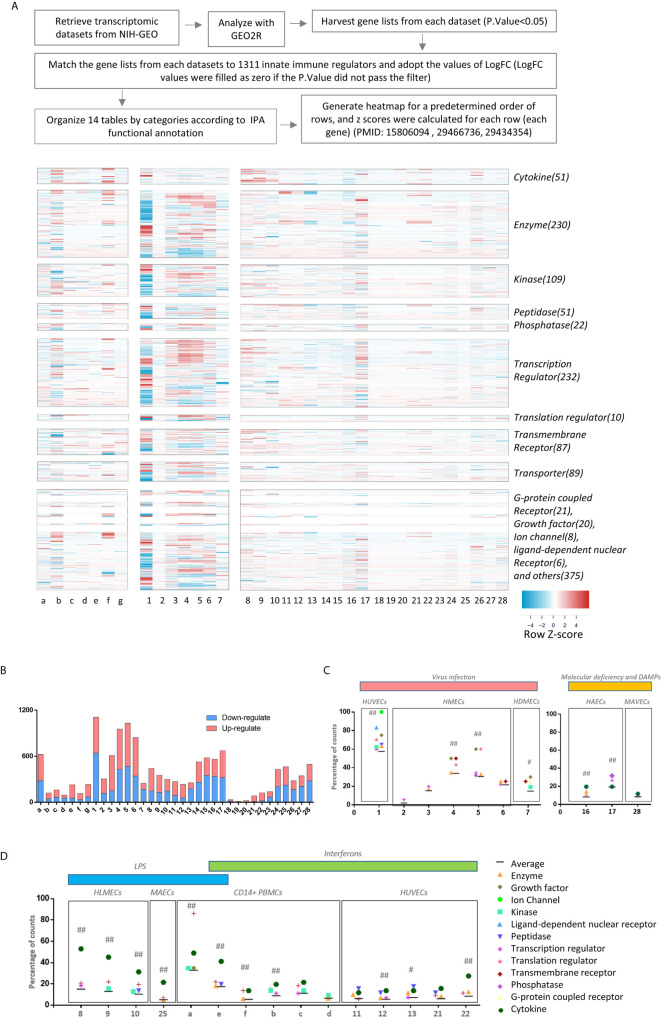
Figure 1.
The heat map analyses indicate that 1311 innate immune regulatomic genes are differentially expressed in various endothelial cells. All the microarray datasets were collected from NIH-NCBI Geo DataSets database (https://www.ncbi.nlm.nih.gov/gds/), whose datasets IDs were included. (A) Twenty-eight endothelial cell microarray datasets (1-28) were collected from NIH-Geo database in 16 published studies. Twenty-four human and four mouse endothelial cells were included in in vitro and ex vivo experiments. Specifically, seven comparisons were set in virus infections, four comparisons were set in LPS stimulation, five were set in interferons treatment, nine were set in sterile danger signals, and other situations were associated with key molecules deficiency of innate immune system. Seven datasets of the microarrays (a-g) from human CD14+ peripheral blood mononuclear cells (PBMCs) or CD14+ PBMCs-derived macrophages stimulated with interferon-g (IFNg) or lipopolysaccharide (LPS), which served as the prototypic innate immune cell controls. The datasets were analyzed to maximally mimic the formats used in the original published studies. The expression profiles of 1311 innate immune regulators from a comprehensive innate immune database (https://www.innatedb.com/) in these 35 microarray datasets were analyzed in a panoramic manner. To avoid the bias resulting from the differences between each independent experimental design and techniques, the values of Log fold change (logFC) were adopted in each specific experimental comparison to generate heat map. In addition, cluster analysis grouped the genes that share a similar expression pattern among all samples, regardless of how the data were generated for. A cluster of 1311 genes that shows change (P. value<0.05) in at least one dataset were shown. A color scale was designated the expression signature, where the intensity of the cell's color reflects the value of logFC. Red bar represented the upregulation of gene while blue represented the downregulation of gene (See Supplementary Table 1 ). (B) Bar charts displayed the counts of up- and down-regulate genes with P.value<0.05 and |LogFC|>1 in each datasets (See Supplementary Table 2 ). (C, D) According to function annotation of Ingenuity Pathway Analysis (IPA), genes with significant change (P.value<0.05 and |LogFC|>1) and all 1311 innate immune genes are categorized, respectively. The category that has a higher percentage than average (Average=counts of gene with significance/1311) in each datasets are displayed in the figure. In order to evaluate the counts of changed gene have statistically significant association with categories, we performed Chi-square tests in JMP pro. ## means P.value (under Prob>ChiSq) <0.001; # means P.value <0.05; (See Supplementary Table 3 ).

